The RBA continues to address the nation’s inflation challenge with today’s 0.25% increase.
Last week’s inflation figures showed a 1.4% increase for the March quarter. This is a 7% increase in the past year which indicates the cost-of-living challenge faced by Australian households.
The ABA encourages those customers who are concerned about their financial situation to shop around to find the most suitable deal for their individual needs. Competition in the banking sector is strong and record levels of mortgage refinancing continues.
Banks strongly encourage any customers experiencing financial difficulty to reach out to access bank support services and to do so as early as possible. Bank support teams are also proactively communicating with those customers at risk.
Australians have record levels of savings sitting in deposit and offset accounts while arrears remain at low levels. In March 2023 the value of household deposits on the books of ADIs grew for the 22nd month in a row, to $1.37 trillion. The growth between March and February was $14.9b (1.1%) – the highest growth since July 2022.
Figure 1: Deposits held with ADIs, March 2019 – March 2023, $m
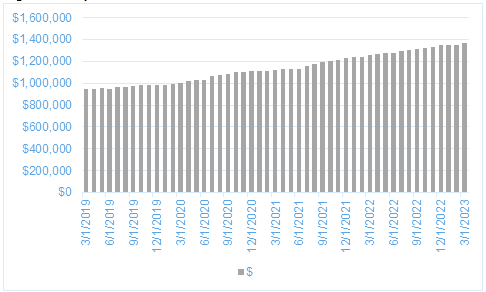
Source: APRA Monthly ADI Statistics; ABA
At $244b, there is now more sitting in mortgage offset accounts than ever before. In fact, there has been a growth of 42 per cent since December 2019 (Figure 2).
Figure 2: Balances sitting in offset accounts, $m, July 2019 – December 2022
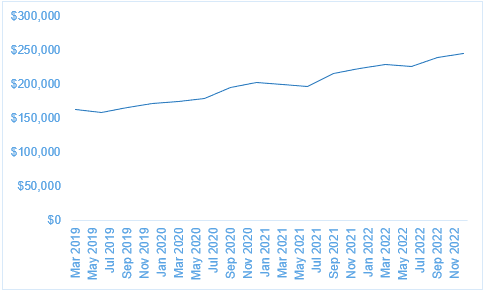
Source: APRA Quarterly ADI Statistics, Tab 1b; ABA
The value of non-performing loans (i.e. those 90+ days in arrears) fell in the last quarter of 2022, while loans 30-89 days past due has increased slightly, though remained below pre-COVID levels (Figure 3). The proportion of non-performing loans relative to the housing portfolio now sits at 0.59 per cent, down from 0.62 per cent in the September quarter and 0.79 per cent in December 2019.
Figure 3: Housing loans past due and non-performing, $m, July 2019 – December 2022
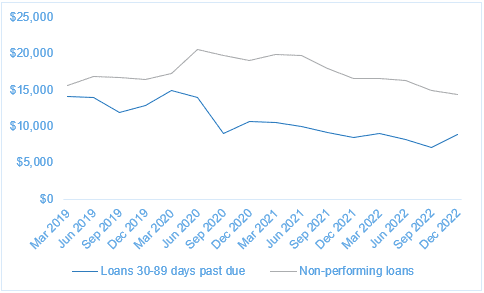
Source: APRA Quarterly ADI Statistics, Tab 1b; ABA


/who-and-sesam-event-in-lyon.tmb-768v.jpg?sfvrsn=6788f1a1_1)


