Spending on services was the dominant driver in a 13 per cent year-on-year increase in overall spending last week, according to latest research from CBA’s economists.
The latest household credit and debit card spending analysis from Commonwealth Bank’s Global Economic and Markets Research team shows that spending lifted over the week to Friday, 6 November and is now up 13 per cent compared to the same period last year.
The lift in overall card spending is the biggest year-on-year increase since the team started analysing the data in March 2020 and first double digit increase since July 2020.
CBA’s Senior Economist Belinda Allen said: “The easing of restrictions in Victoria, and more open and the prospect of more open internal borders, saw card spending surge.
“There was a lift in both online and in-store spending showing the breadth of the rise.”
Ms Allen said that the lift in overall spending highlights the importance of confidence in the health outcome and the level of income support in the Australian economy at present.
“Card spending on both goods and services lifted over the past week, but services spending was the dominant driver. Services spending on cards rose by 5 per cent compared to a year ago and was the first positive print since the nationwide lockdown in March.”
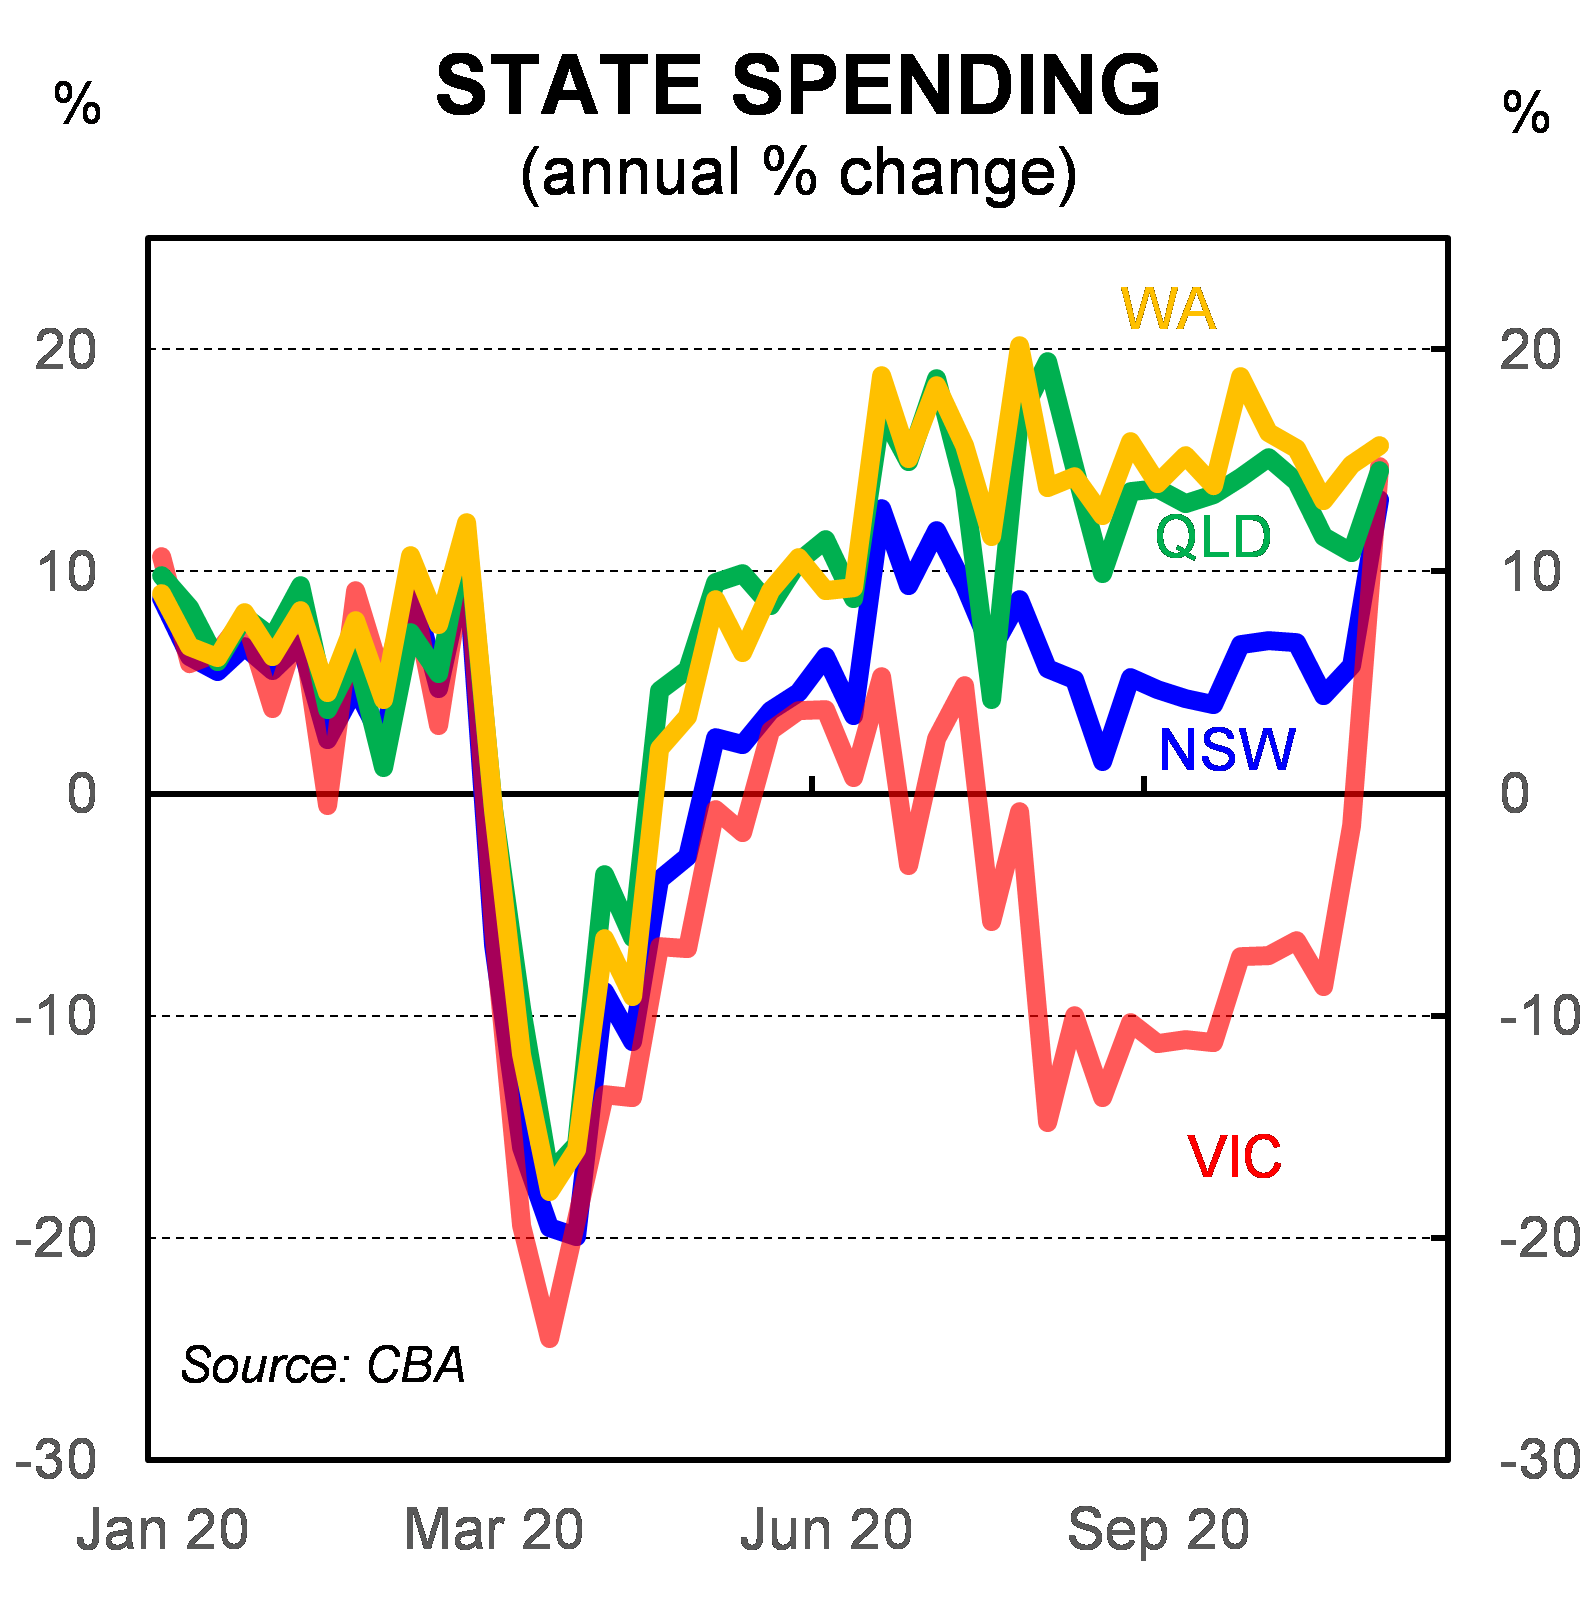
In Victoria, annual card spend was up 15 per cent for week ending Friday, 6 November as compared to the same period last year. The other states also saw a lift in spending over the past week.
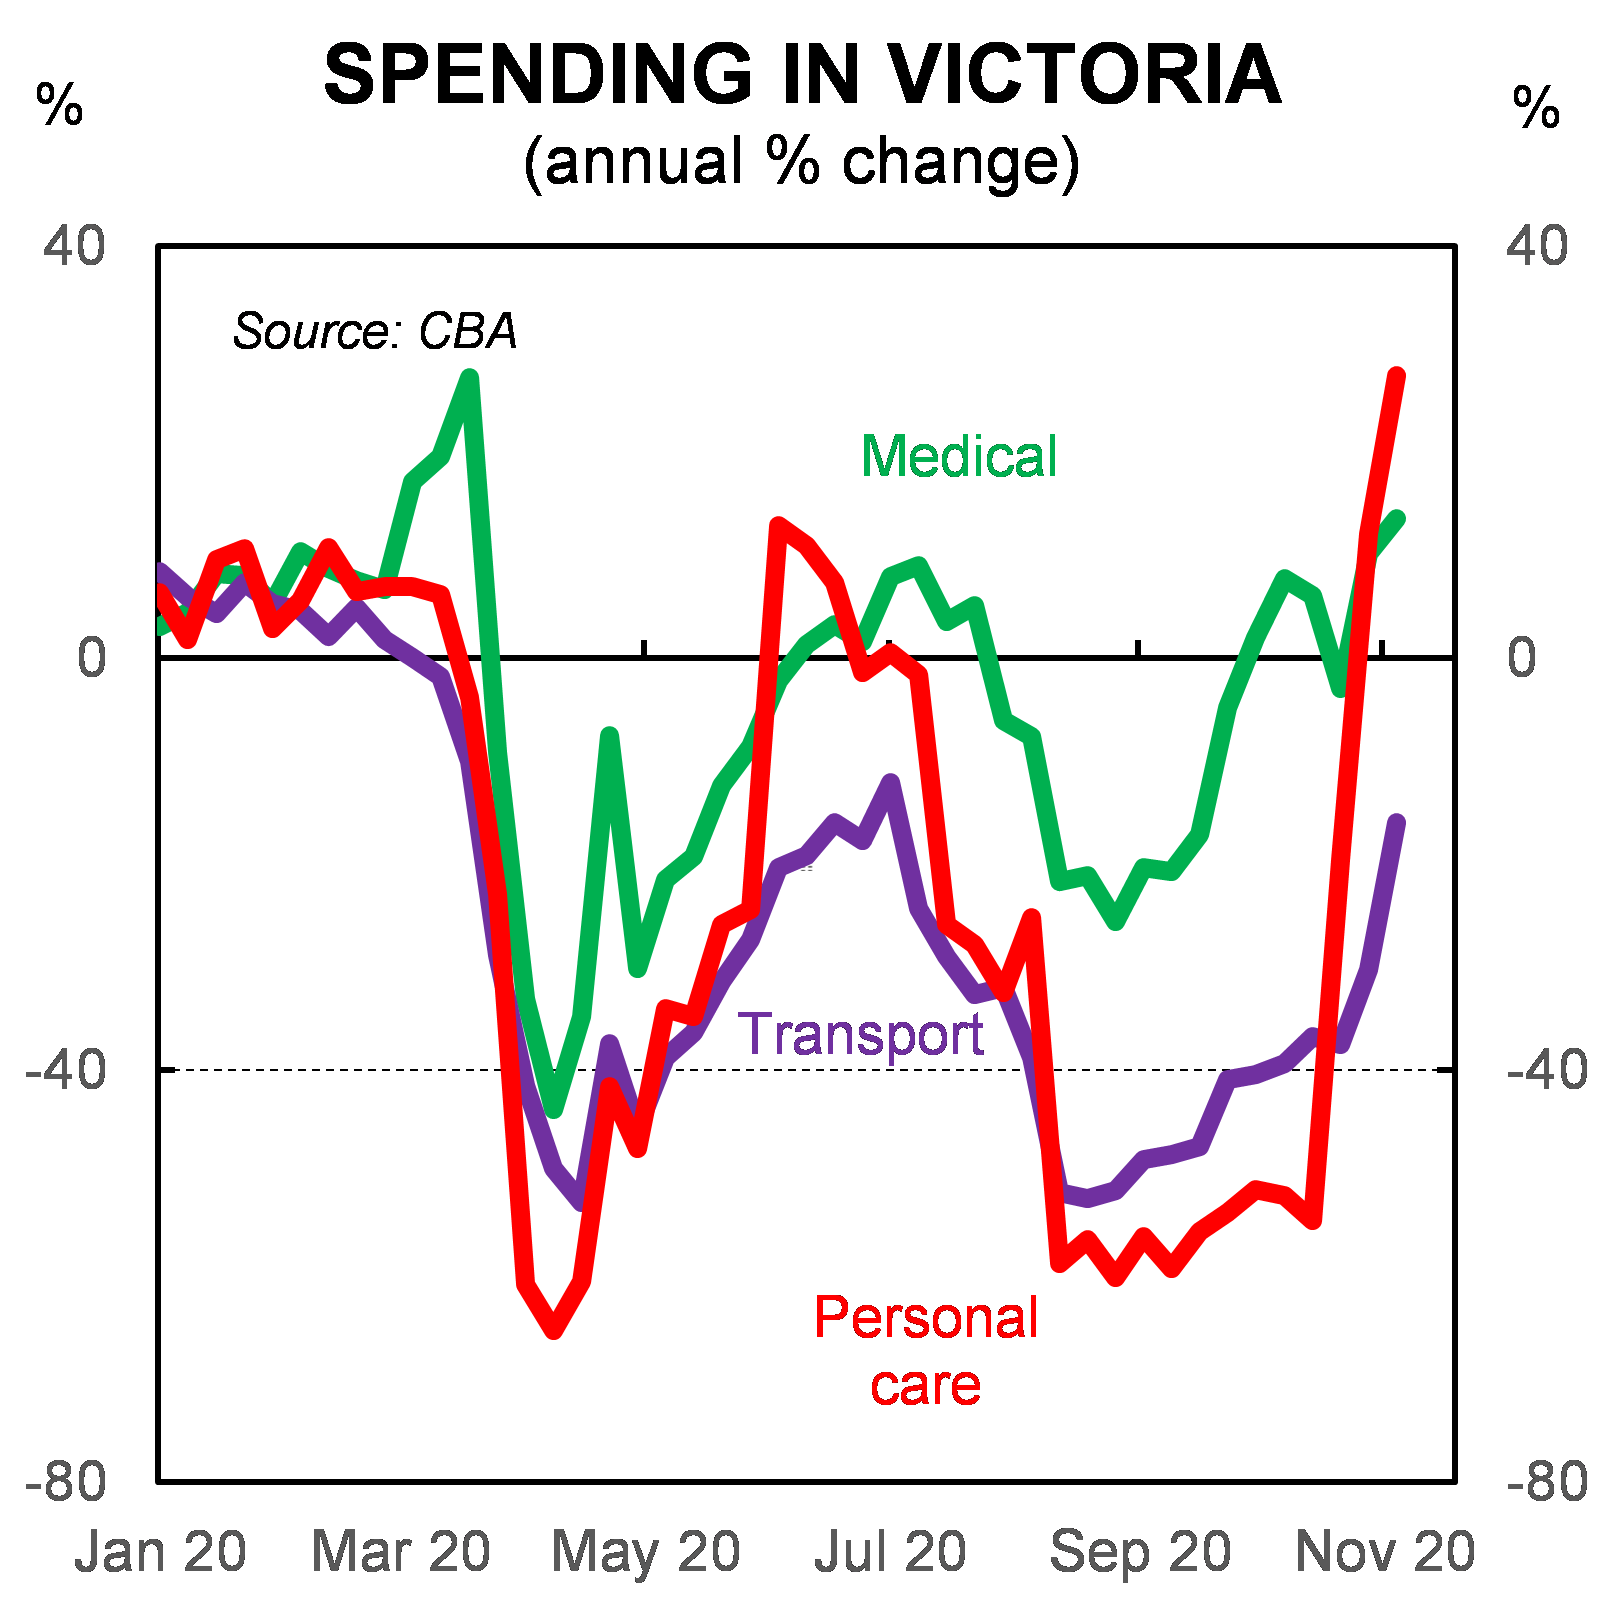
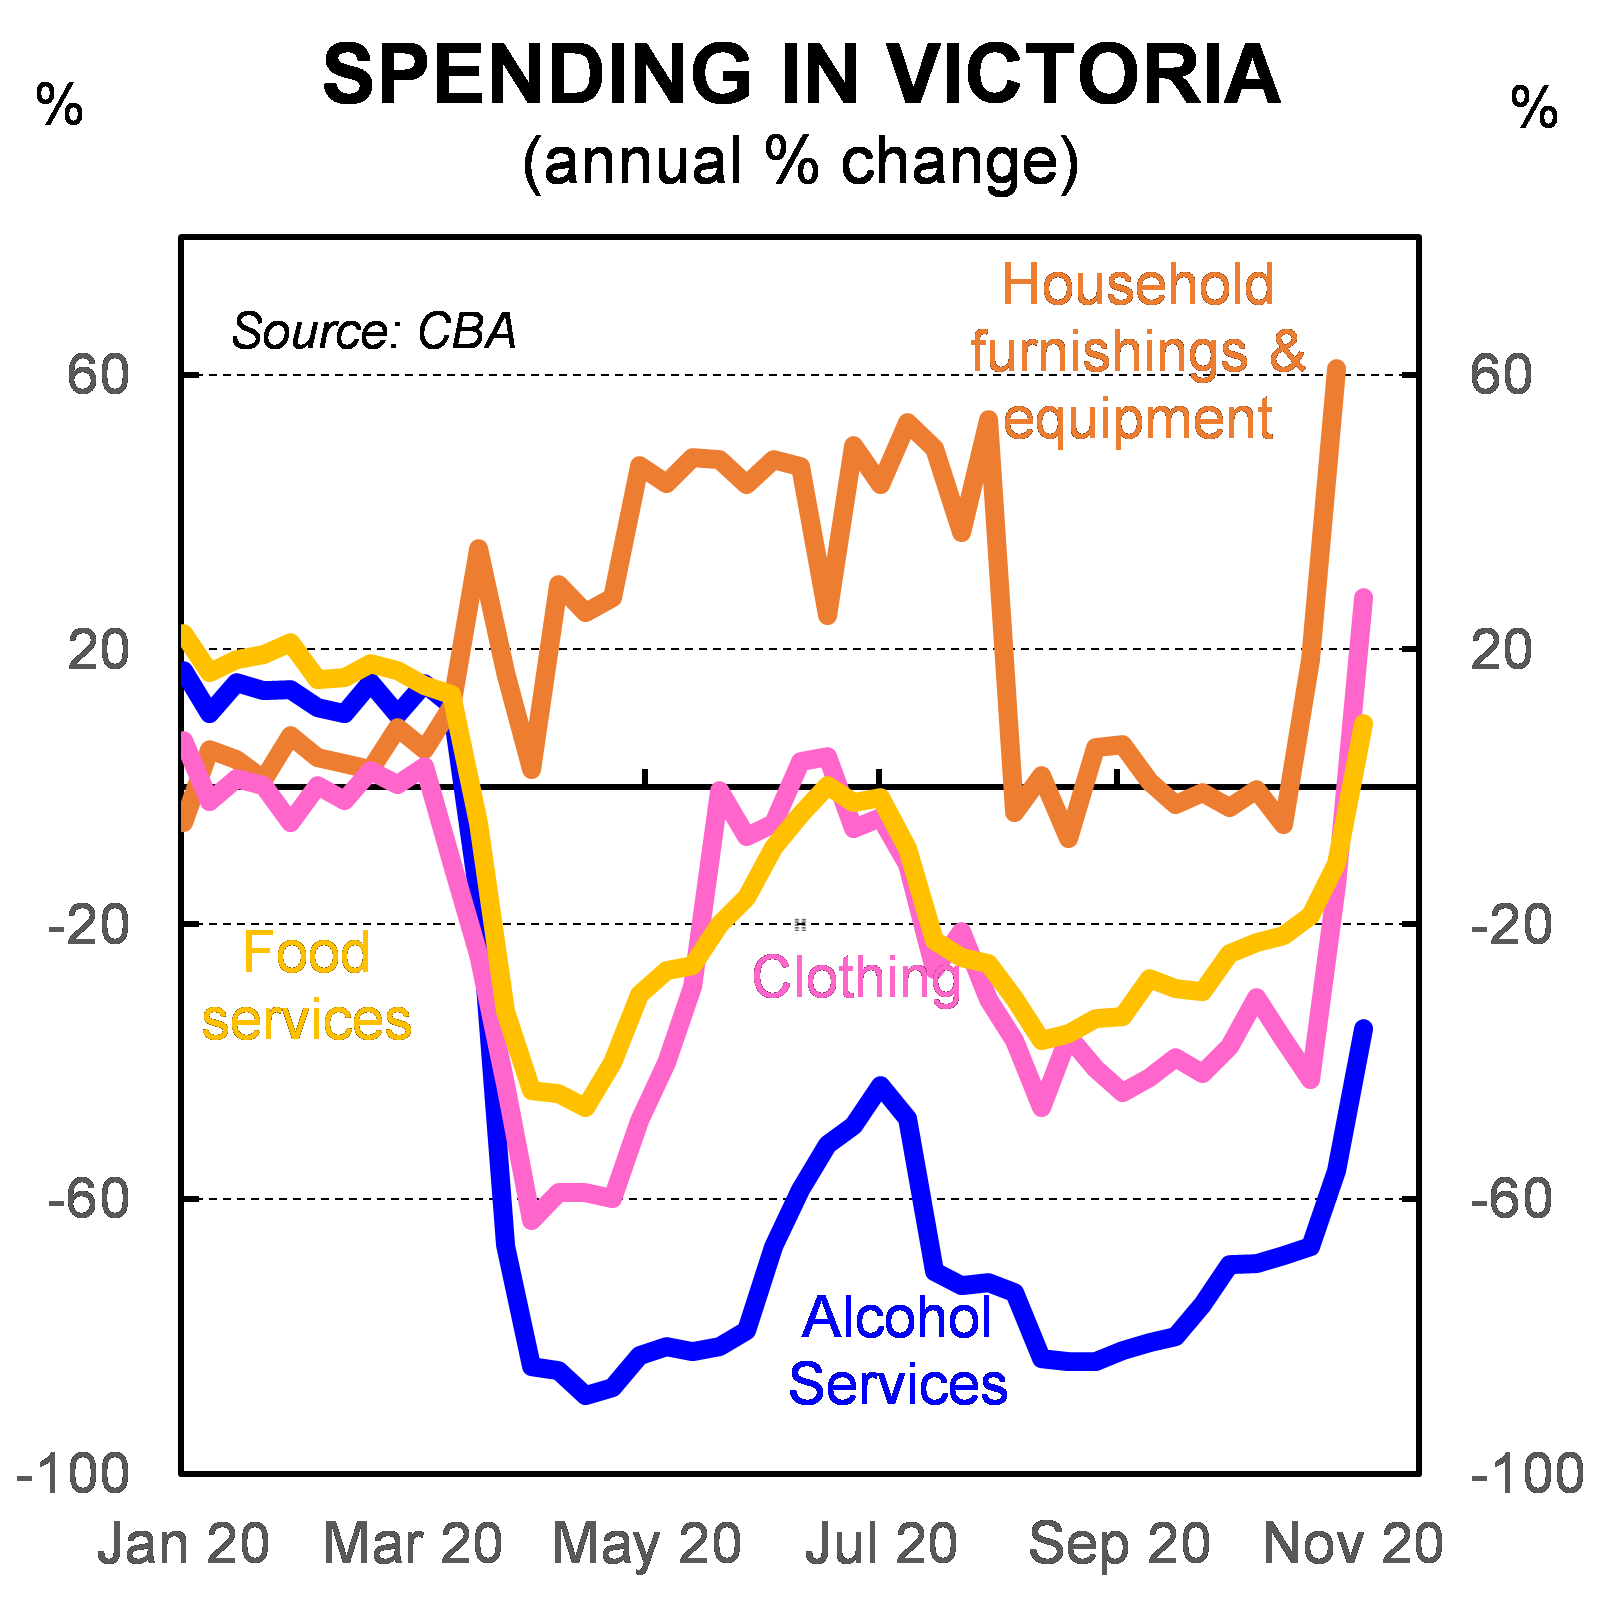
“Looking at Victoria, pent up demand and an easing of restrictions saw spending rise in all but one category we track, with communication the exception.
“Eating and drinking out still faces some restrictions but spending in this category is recovering and shows growing confidence in the health outcome,” Ms Allen said.
The table below shows CBA household credit and debit card spending compared to results a year earlier. The information has been developed by CBA’s Global Economic & Markets Research team.
Week ending 23 Oct | Week ending 30 October | Week ending 6 November | |
Overall spending | 4% | 6% | 13% |
Overall goods spending (incl. packaged food, furniture, clothing, etc.) | 14% | 16% | 21% |
Overall services spending (incl. activity-based spend: travel, education, etc.) | -6% | -5% | 5% |
Overall NSW spending | 8% | 6% | 10% |
Overall Vic spending | -9% | -1% | 15% |
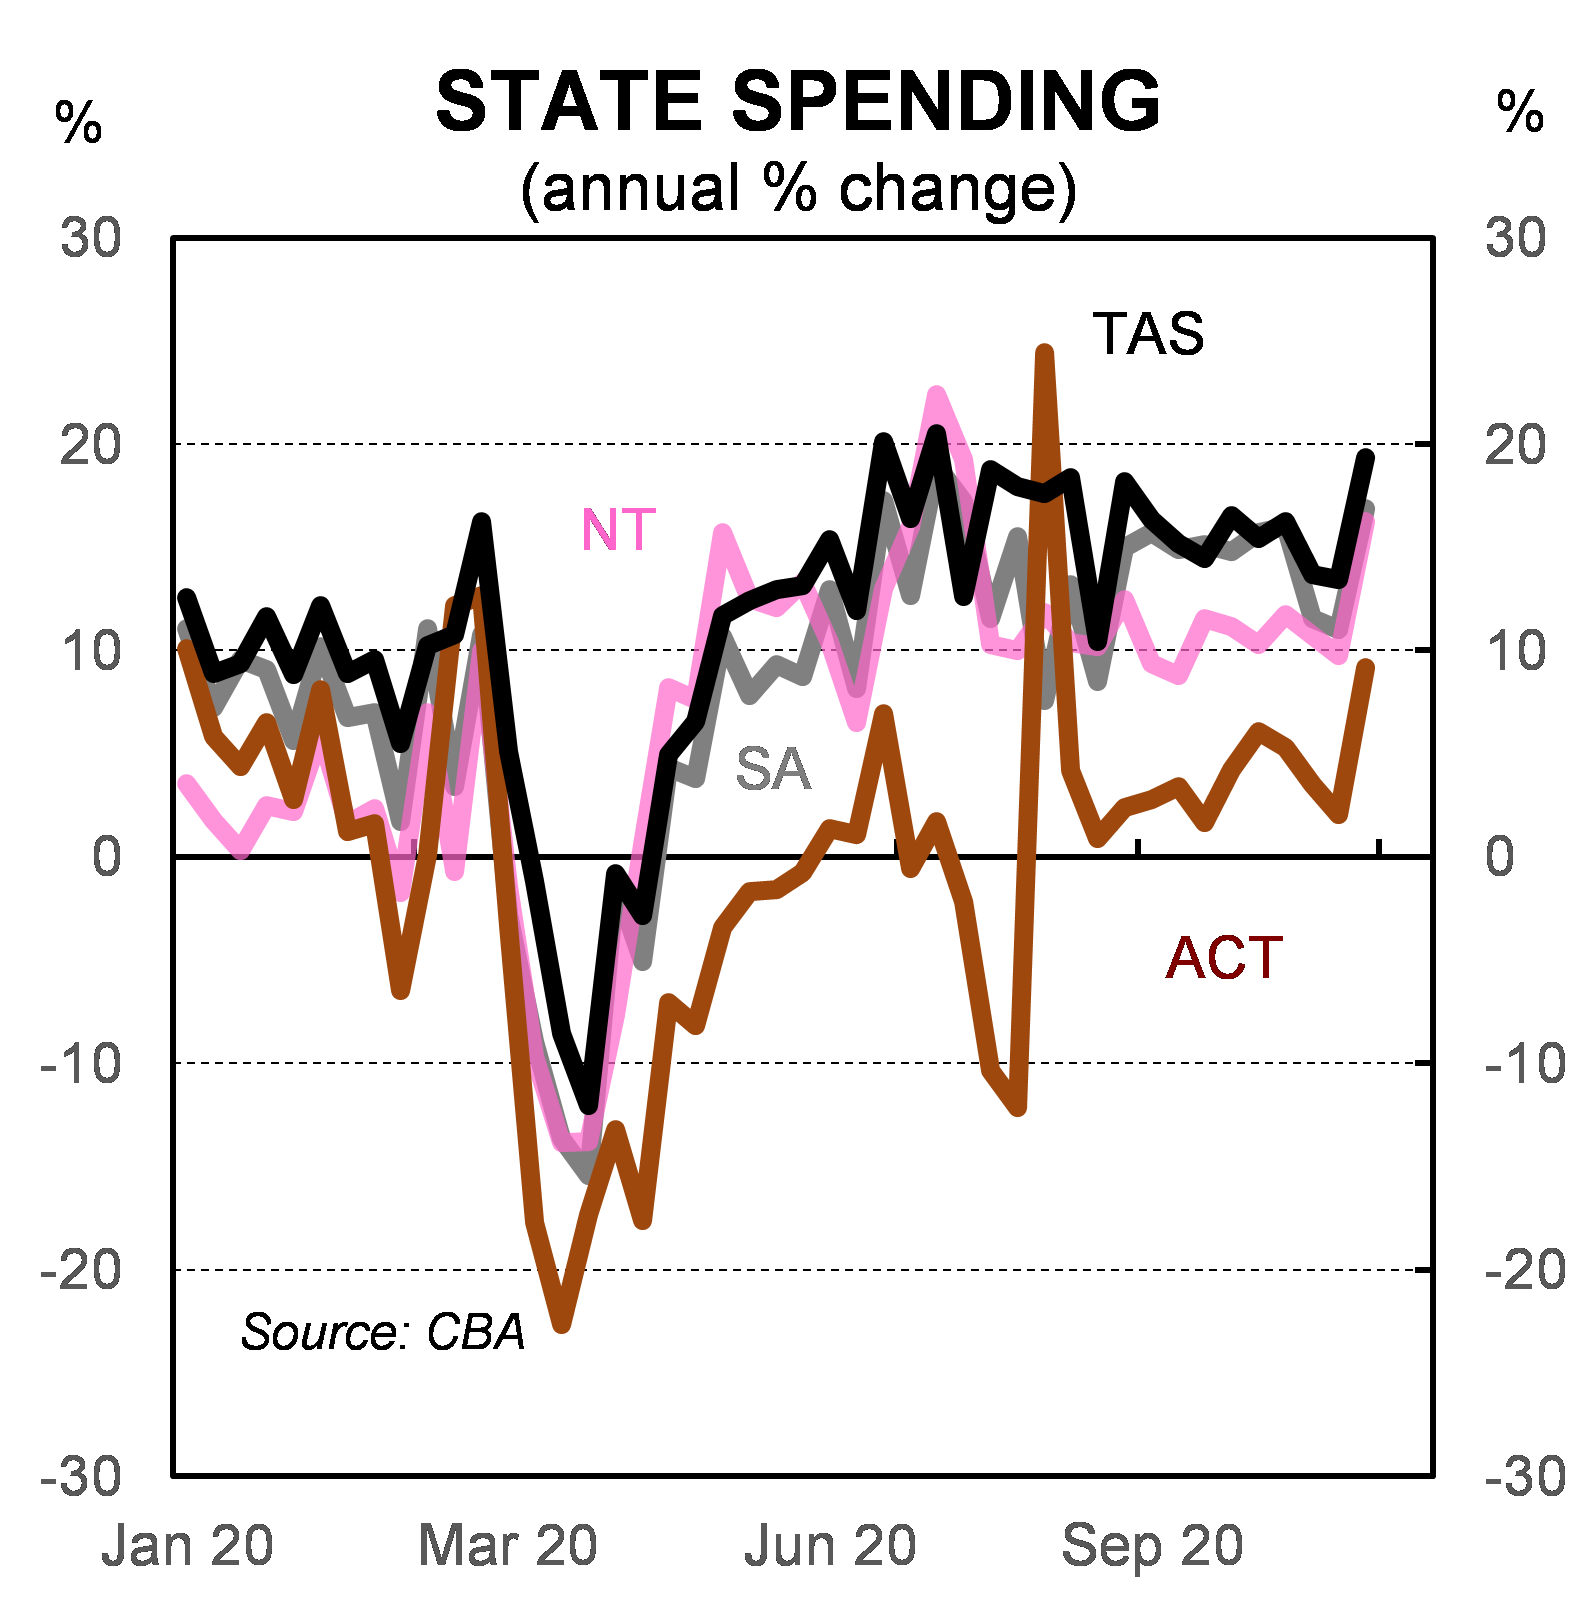
Overall ACT spending | 3% | 2% | 9% |
Overall Tas spending | 14% | 13% | 19% |
Overall WA spending | 13% | 15% | 16% |
Overall Qld spending | 12% | 11% | 15% |
Overall SA spending | 12% | 11% | 17% |
Overall NT spending | 11% | 10% | 16% |
Food | 16% | 14% | 18% |
Food goods (mostly grocery stores and supermarkets) | 21% | 17% | 19% |
Food services (includes cafes and restaurants) | 7% | 8% | 15% |
Alcohol | 15% | 13% | 17% |
Alcohol goods (bottle shops) | 30% | 26% | 29% |
Alcohol services (pubs, hotels, etc.) | -8% | -8% | -2% |
Transport (includes public transport) | -12% | -12% | -6% |
Household furnishings & equipment | 18% | 22% | 37% |
Apparel (clothing and footwear) | -8% | 2% | 14% |
Personal care (beauty and barber shops, cosmetic stores, health and beauty spas) | 2% | 11% | 14% |
Medical care & health expenses (includes pharmacies, doctors, dentists, allied health) | 9% | 12% | 13% |
Education (includes tertiary/secondary/primary education) | -3% | 0% | 3% |


