Housing affordability decreased in 2023, driven by a simultaneous increase in housing values, rent values and interest rates, a new report by ANZ and CoreLogic has found.
Released today, the ANZ CoreLogic Housing Affordability Report takes a retrospective look on the state of affordability of home ownership in Australia over the past 12 months, and the differences in market dynamics across the major metropolitan centres and in Australia’s regional areas.
The report revealed that in the year to September, the time to save a 20 per cent deposit has climbed to 10 years nationally, and to 12.6 years in Sydney. Sydney also requires a record 58.1 per cent of income to service a new loan.
Unlike Sydney, some aspects of affordability have improved in Melbourne for buyers in the past five years to September, with the time to save a deposit sitting at 9.6 years, down from 10.2 years in September 2018.
Quarterly housing affordability metrics – dwellings, Sydney and Melbourne
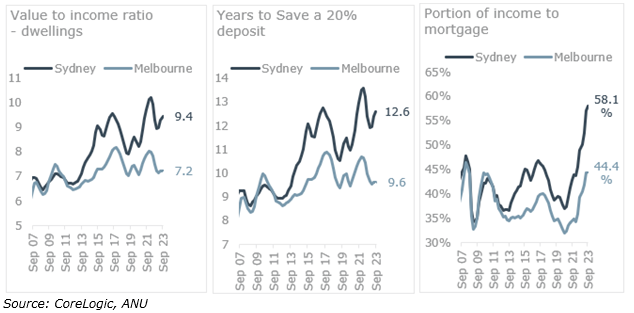
The relative ‘under-performance’ in Melbourne dwelling values – that has led to a comparatively affordable market over time – is due to more supply of dwelling completions over the past 15 years. ABS building activity data[1] shows there were 21 per cent more dwelling completions in Victoria when compared to NSW in the same period.
In 2023, there was also a further departure in affordability between house and unit values, which currently remain at elevated levels of 28.6 per cent. Prior to the pandemic, the decade average difference between house and unit values nationally was 7.3 per cent.
ANZ Senior Economist, Adelaide Timbrell said: “The time to save a 20 per cent deposit has only shifted by around two months nationally for units since the onset of COVID-19, while for houses the time to save has blown out by almost two years.”
“This presents a clear shift for those hoping to enter the housing market, as units have stayed within a reasonable price range for new home buyers, while houses have become more out of reach.”
Regional dwelling markets are also seeing a sustained uplift in purchase values since the start of the pandemic, even more than the capital city dwelling markets, highlighting that regional Australia is no longer the affordable alternative to capital cities.
CoreLogic Head of Australian Research Eliza Owen said: “Regional Australia is often thought of as a more affordable alternative for housing, a way to reduce housing costs by compromising distance to major employment hubs.”
“The COVID-boom in regional migration and values means it’s really not that much more affordable now, and there’s very little difference in the combined regional and capital city affordability metrics.”
As of October, the regional Australian dwelling market has sustained a 44.4 per cent uplift in dwelling purchase values since the start of COVID, compared with a 26.4 per cent uplift across the capital city dwelling market.
“In 2024, housing affordability is likely to get worse before it gets better. Dwelling supply will continue to be strained by the high interest rate environment, which has reduced approvals and potential for new housing development in 2024. Demand will probably be the only thing can adjust in the short term, so we may see average people per household rise,” Miss Owen said.
[1] https://www.abs.gov.au/statistics/industry/building-and-construction/building-activity-australia/latest-release#data-downloads
The ANZ CoreLogic Housing Affordability report utilises gross median household income data modelled by the ANU Centre for Social Research and Methods to September 2023, as well as CoreLogic housing values and rents. There are four aspects of housing affordability referenced throughout the report. These are the median dwelling value to income ratio, the portion of income required to service a new mortgage, the number of years to save a 20% deposit, and the portion of income required to service rents on a new lease. Appendix 1 provides more detailed definitions of these metrics. Appendix 2 provides a summary of affordability metrics to date for various regions.


