Most popular feature on our website
Visits to our website tell us that watching the rain radar is a favourite national pastime.
Our website is one of the most visited Australian government websites and the rain radar and weather maps are the most used feature.
Let’s take a look at the radar and weather map features, how you can customise it, and how it differs to other radar images.
How to use the weather map
Find your location
There are a few ways to find your location on the Rain radar and weather map:
- use your current location
- search for a location
- use the map’s controls to pan and zoom to a location.
You’ll also find the weather map on all location pages.
There are 3 ways to get forecasts, observations and the weather map all on one page:
- Select the location on the map and View more at this location.
- Enter your location or postcode in the main menu search bar.
- Click the star and select one of your saved favourite locations.
Learn how to save your most visited locations to your favourites.
Customise your map
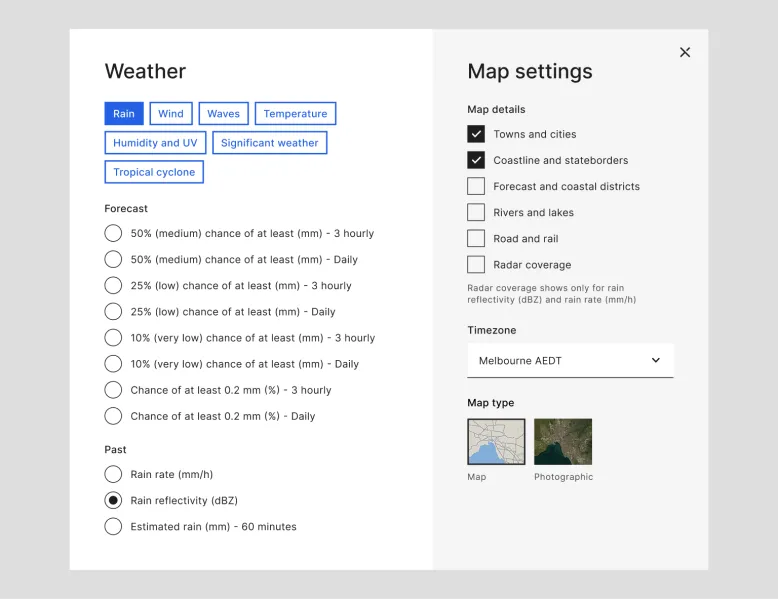
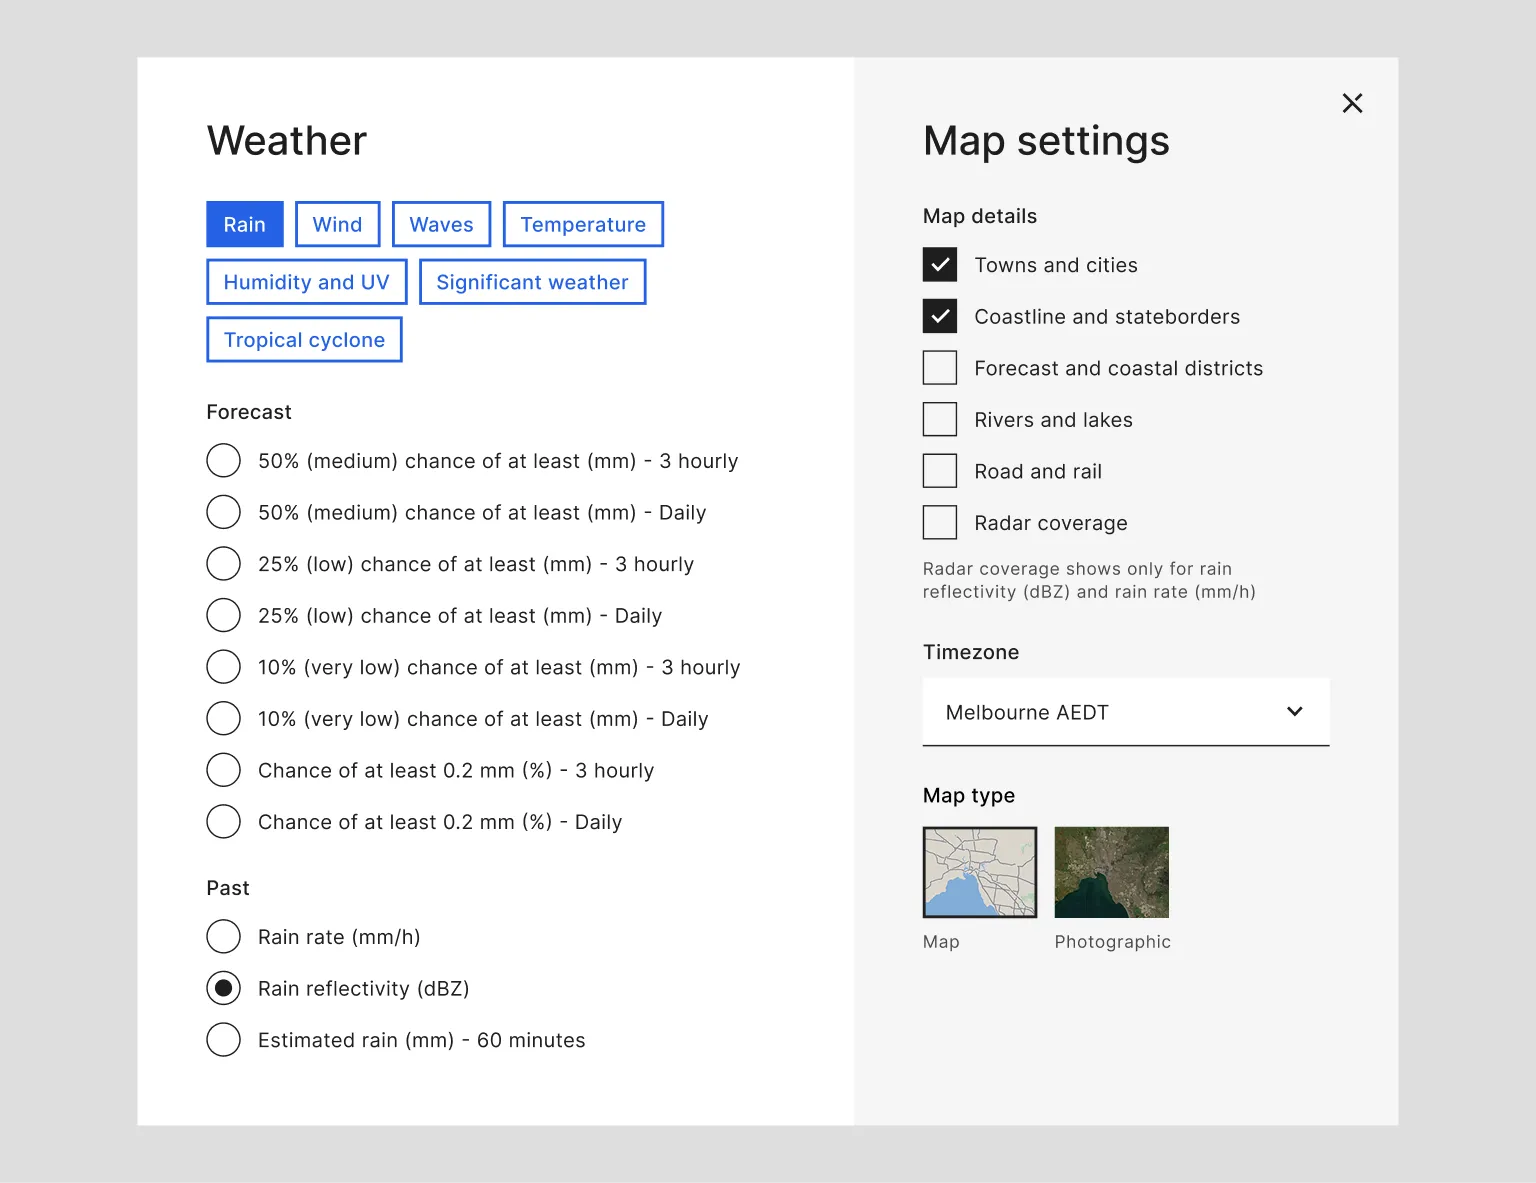
‘More weather’ is where you can choose what you want your map to look like and what weather to display. Under map settings you can add map features such as towns and cities, rivers and lakes, and radar coverage.
Use the buttons or tabs to choose the type of weather you want to see:
- rain, wind and waves
- temperature, humidity and UV
- significant weather, including thunderstorms, snow and fog
- tropical cyclone.
Ways to view rain on the map
You can choose to see observed rainfall as:
- rain rate in millimetres per hour (mm/h)
- rain reflectivity (intensity) in decibels of reflectivity (dBZ)
- estimated rain (mm) over the past 60 minutes.
Rain rate shows the depth of water that would accumulate in an hour if the rain kept falling at that exact same rate.
Rain reflectivity indicates the intensity of precipitation. It shows the strength of the radar signal reflected back from the precipitation. This depends on the diameter and number of drops in the cloud, as well as the presence of ice. The sensitivity to ice means that hail may show very strongly in reflectivity images even though the corresponding rain rate is low.
Estimated rain combines rain gauge and radar data, which is more accurate than using one of these alone.
Rain forecasts on the map
The map displays 3-hourly and daily chance of rainfall animations for different probabilities (10%, 25% and 50% chance of, chance of at least 0.2 mm).
If you also use the BOM Weather app, you may notice the app also shows a forecast of rain over the next 90 minutes. Sometimes referred to as ‘nowcasting’, this option is not currently available in any of our web-based radar images.