The estimated number of people migrating from New Zealand to Australia was 31,300 in the year ended June 2019, Stats NZ said today.
This is half the peak of 62,800 in the June 2012 year.
“Trans-Tasman migration has ebbed and flowed at different times, and currently we have relatively low numbers of migrants departing to Australia,” population insights senior analyst Kim Dunstan said.
New data on migrant departures to Australia
This is the first time Stats NZ has published figures showing migrant departures to Australia, since the end of traveller departure cards more than a year ago. At that time the official measure of migration also changed from being based on intentions to outcomes.
“A statistical downside of removing the departure card in November 2018 is no longer knowing where our migrant departures are going,” Mr Dunstan said.
“There is no existing New Zealand data source that tells us the destination of migrant departures. However, we’ve collaborated with our Australian colleagues to publish a new series of migrant departures to Australia.”
The estimates are based on data collected at the Australian border and published by the Australian Bureau of Statistics (ABS). Australia uses the same 12/16-month rule as New Zealand to identify migrants arriving and departing, and has done so since 2007. The outcomes-based measure of migration using the 12/16-month rule is based on the actual duration of stay/absence of travellers after crossing the border. Australia also removed their departure card, in July 2017.
“The new outcomes-based estimates follow similar trends to the old Stats NZ intentions-based measure of flows to Australia,” Mr Dunstan said.
“The new estimates are higher than the intentions-based measure, which understated both migrant arrivals and migrant departures.”
The intentions-based measure of migration relied on the stated intentions of travellers at the time of their border crossing. This was not always the same as what they ended up doing, because of changed circumstances or different interpretations of the passenger card questions. The intentions-based measure of migrant departures and net migration is not available after October 2018.
| Rolling year ended | Estimated migrant departures (from ABS outcomes-based data) | Permanent and long-term departures (from Stats NZ intentions-based data) |
| Jun-89 | 42866 | |
| Sep-89 | 39159 | |
| Dec-89 | 33929 | |
| Mar-90 | 28253 | |
| Jun-90 | 24015 | |
| Sep-90 | 21453 | |
| Dec-90 | 19608 | |
| Mar-91 | 17619 | |
| Jun-91 | 16010 | |
| Sep-91 | 15055 | |
| Dec-91 | 15359 | |
| Mar-92 | 15454 | |
| Jun-92 | 15715 | |
| Sep-92 | 16173 | |
| Dec-92 | 16036 | |
| Mar-93 | 15715 | |
| Jun-93 | 15645 | |
| Sep-93 | 15485 | |
| Dec-93 | 15535 | |
| Mar-94 | 16243 | |
| Jun-94 | 17213 | |
| Sep-94 | 18155 | |
| Dec-94 | 18828 | |
| Mar-95 | 19794 | |
| Jun-95 | 20369 | |
| Sep-95 | 20966 | |
| Dec-95 | 21512 | |
| Mar-96 | 22149 | |
| Jun-96 | 22981 | |
| Sep-96 | 23177 | |
| Dec-96 | 23601 | |
| Mar-97 | 24574 | |
| Jun-97 | 25026 | |
| Sep-97 | 25586 | |
| Dec-97 | 26030 | |
| Mar-98 | 26075 | |
| Jun-98 | 26226 | |
| Sep-98 | 27217 | |
| Dec-98 | 28469 | |
| Mar-99 | 30323 | |
| Jun-99 | 31798 | |
| Sep-99 | 32552 | |
| Dec-99 | 33875 | |
| Mar-00 | 35376 | |
| Jun-00 | 36296 | |
| Sep-00 | 36959 | |
| Dec-00 | 38248 | |
| Mar-01 | 42367 | |
| Jun-01 | 41962 | |
| Sep-01 | 39848 | |
| Dec-01 | 36033 | |
| Mar-02 | 28734 | |
| Jun-02 | 26766 | |
| Sep-02 | 25852 | |
| Dec-02 | 25070 | |
| Mar-03 | 24647 | |
| Jun-03 | 23283 | |
| Sep-03 | 23393 | |
| Dec-03 | 24569 | |
| Mar-04 | 25700 | |
| Jun-04 | 26999 | |
| Sep-04 | 42578 | 27979 |
| Dec-04 | 40080 | 28938 |
| Mar-05 | 40522 | 31043 |
| Jun-05 | 41922 | 33019 |
| Sep-05 | 42819 | 34304 |
| Dec-05 | 43545 | 34766 |
| Mar-06 | 43305 | 34145 |
| Jun-06 | 43534 | 33792 |
| Sep-06 | 44388 | 33866 |
| Dec-06 | 45693 | 34015 |
| Mar-07 | 47642 | 36510 |
| Jun-07 | 49895 | 38336 |
| Sep-07 | 50985 | 39773 |
| Dec-07 | 52474 | 41634 |
| Mar-08 | 54432 | 43419 |
| Jun-08 | 55773 | 45348 |
| Sep-08 | 57385 | 47166 |
| Dec-08 | 57933 | 48452 |
| Mar-09 | 55690 | 46658 |
| Jun-09 | 50969 | 42231 |
| Sep-09 | 46272 | 37362 |
| Dec-09 | 42486 | 32755 |
| Mar-10 | 41281 | 30532 |
| Jun-10 | 42906 | 31704 |
| Sep-10 | 45972 | 33814 |
| Dec-10 | 49193 | 36830 |
| Mar-11 | 53719 | 40906 |
| Jun-11 | 57571 | 44869 |
| Sep-11 | 60075 | 48829 |
| Dec-11 | 61830 | 51054 |
| Mar-12 | 62688 | 53237 |
| Jun-12 | 62832 | 53763 |
| Sep-12 | 62579 | 53729 |
| Dec-12 | 61785 | 53676 |
| Mar-13 | 59156 | 51273 |
| Jun-13 | 55357 | 48027 |
| Sep-13 | 51159 | 43411 |
| Dec-13 | 46962 | 39154 |
| Mar-14 | 42233 | 34002 |
| Jun-14 | 38965 | 30514 |
| Sep-14 | 36925 | 28582 |
| Dec-14 | 35327 | 27072 |
| Mar-15 | 34419 | 25990 |
| Jun-15 | 33857 | 25246 |
| Sep-15 | 33571 | 24903 |
| Dec-15 | 33718 | 24504 |
| Mar-16 | 34439 | 23905 |
| Jun-16 | 35825 | 23770 |
| Sep-16 | 37039 | 23820 |
| Dec-16 | 37081 | 24220 |
| Mar-17 | 35892 | 24539 |
| Jun-17 | 34459 | 24881 |
| Sep-17 | 33236 | 25069 |
| Dec-17 | 32392 | 24841 |
| Mar-18 | 32063 | 24737 |
| Jun-18 | 31845 | 25173 |
| Sep-18 | 31755 | 25710 |
| Dec-18 | 31530 | |
| Mar-19 | 31456 | |
| Jun-19 | 31266 |
Small net outflow to Australia
The new estimates can be combined with existing Stats NZ data to estimate net migration with Australia and the ‘rest of the world’ combined.
While 31,300 people migrated from New Zealand to Australia in the year ended June 2019, 27,600 migrated from Australia to New Zealand. About 4 in 5 migrant departures to Australia, and 2 in 3 migrant arrivals from Australia, were New Zealand citizens.
Net migration to Australia – the difference between migrant arrivals and migrant departures – amounted to a net outflow of 3,600 in the year ended June 2019. This compares with the highest-ever net outflow to Australia of 43,500 in the year ended March 2012.
“Although New Zealand traditionally loses more people to Australia than it gains, the latest net flows to Australia are small by historical standards.”
The historical ups and downs in migration with Australia reflect a combination of factors, including relative economic and labour market conditions between Australia and New Zealand, and Australian immigration policy changes.
| Rolling year ended | Estimated net migration (from Stats NZ and ABS outcomes-based data) | Net permanent and long-term migration (from Stats NZ intentions-based data) |
| Jun-89 | 31016 | |
| Sep-89 | 26568 | |
| Dec-89 | 19932 | |
| Mar-90 | 12836 | |
| Jun-90 | 7360 | |
| Sep-90 | 3802 | |
| Dec-90 | 939 | |
| Mar-91 | -1216 | |
| Jun-91 | -1910 | |
| Sep-91 | -1612 | |
| Dec-91 | 883 | |
| Mar-92 | 2265 | |
| Jun-92 | 2842 | |
| Sep-92 | 3714 | |
| Dec-92 | 3648 | |
| Mar-93 | 3608 | |
| Jun-93 | 3979 | |
| Sep-93 | 3295 | |
| Dec-93 | 2896 | |
| Mar-94 | 3393 | |
| Jun-94 | 3889 | |
| Sep-94 | 4996 | |
| Dec-94 | 5932 | |
| Mar-95 | 6795 | |
| Jun-95 | 7723 | |
| Sep-95 | 8260 | |
| Dec-95 | 8618 | |
| Mar-96 | 9156 | |
| Jun-96 | 9880 | |
| Sep-96 | 10389 | |
| Dec-96 | 11062 | |
| Mar-97 | 12054 | |
| Jun-97 | 12481 | |
| Sep-97 | 13090 | |
| Dec-97 | 14039 | |
| Mar-98 | 14659 | |
| Jun-98 | 14738 | |
| Sep-98 | 16266 | |
| Dec-98 | 17863 | |
| Mar-99 | 20069 | |
| Jun-99 | 22219 | |
| Sep-99 | 22662 | |
| Dec-99 | 23369 | |
| Mar-00 | 24817 | |
| Jun-00 | 25526 | |
| Sep-00 | 26113 | |
| Dec-00 | 27668 | |
| Mar-01 | 31577 | |
| Jun-01 | 30965 | |
| Sep-01 | 28359 | |
| Dec-01 | 23847 | |
| Mar-02 | 16095 | |
| Jun-02 | 13707 | |
| Sep-02 | 12845 | |
| Dec-02 | 12052 | |
| Mar-03 | 11258 | |
| Jun-03 | 9673 | |
| Sep-03 | 9310 | |
| Dec-03 | 10225 | |
| Mar-04 | 11034 | |
| Jun-04 | 12422 | |
| Sep-04 | 21440 | 13609 |
| Dec-04 | 19628 | 14722 |
| Mar-05 | 20696 | 17166 |
| Jun-05 | 22592 | 19277 |
| Sep-05 | 23716 | 20697 |
| Dec-05 | 24610 | 21377 |
| Mar-06 | 24558 | 20713 |
| Jun-06 | 24994 | 20459 |
| Sep-06 | 25776 | 20598 |
| Dec-06 | 27014 | 20709 |
| Mar-07 | 28896 | 23266 |
| Jun-07 | 31037 | 24953 |
| Sep-07 | 32129 | 26194 |
| Dec-07 | 33774 | 27998 |
| Mar-08 | 35980 | 29892 |
| Jun-08 | 37460 | 31923 |
| Sep-08 | 39251 | 33929 |
| Dec-08 | 39644 | 35395 |
| Mar-09 | 37204 | 33590 |
| Jun-09 | 31956 | 28676 |
| Sep-09 | 26610 | 23102 |
| Dec-09 | 22152 | 17962 |
| Mar-10 | 20355 | 14890 |
| Jun-10 | 21701 | 15908 |
| Sep-10 | 24602 | 18088 |
| Dec-10 | 28124 | 20988 |
| Mar-11 | 32941 | 25331 |
| Jun-11 | 37398 | 29915 |
| Sep-11 | 40467 | 34151 |
| Dec-11 | 42475 | 36868 |
| Mar-12 | 43486 | 39456 |
| Jun-12 | 43397 | 39809 |
| Sep-12 | 42538 | 39520 |
| Dec-12 | 40463 | 38796 |
| Mar-13 | 36526 | 35518 |
| Jun-13 | 31028 | 31246 |
| Sep-13 | 24750 | 25303 |
| Dec-13 | 18399 | 19605 |
| Mar-14 | 12172 | 12856 |
| Jun-14 | 8252 | 8325 |
| Sep-14 | 5704 | 5986 |
| Dec-14 | 3344 | 3797 |
| Mar-15 | 1972 | 2328 |
| Jun-15 | 950 | 1185 |
| Sep-15 | 282 | 220 |
| Dec-15 | 74 | -769 |
| Mar-16 | 334 | -1862 |
| Jun-16 | 1944 | -1933 |
| Sep-16 | 3477 | -1965 |
| Dec-16 | 3939 | -1563 |
| Mar-17 | 3555 | -1018 |
| Jun-17 | 2430 | -560 |
| Sep-17 | 1946 | 66 |
| Dec-17 | 1982 | -109 |
| Mar-18 | 2389 | -8 |
| Jun-18 | 2924 | 831 |
| Sep-18 | 3230 | 1575 |
| Dec-18 | 3893 | |
| Mar-19 | 3835 | |
| Jun-19 | 3643 |
Trans-Tasman migration trends have generally been driven by departures from New Zealand to Australia. By comparison, flows from Australia to New Zealand have hovered at much lower levels – around 20,000 a year during 2004-12 – although they did exceed 30,000 a year during 2014-17.
| Rolling year ended | Migration from New Zealand to Australia (estimated from ABS data) | Migration from Australia to New Zealand (estimated from Stats NZ data) | Net migration from New Zealand to Australia |
| Sep-04 | 42578 | 21138 | 21440 |
| Dec-04 | 40080 | 20452 | 19628 |
| Mar-05 | 40522 | 19826 | 20696 |
| Jun-05 | 41922 | 19330 | 22592 |
| Sep-05 | 42819 | 19103 | 23716 |
| Dec-05 | 43545 | 18935 | 24610 |
| Mar-06 | 43305 | 18747 | 24558 |
| Jun-06 | 43534 | 18540 | 24994 |
| Sep-06 | 44388 | 18612 | 25776 |
| Dec-06 | 45693 | 18679 | 27014 |
| Mar-07 | 47642 | 18746 | 28896 |
| Jun-07 | 49895 | 18858 | 31037 |
| Sep-07 | 50985 | 18856 | 32129 |
| Dec-07 | 52474 | 18700 | 33774 |
| Mar-08 | 54432 | 18452 | 35980 |
| Jun-08 | 55773 | 18313 | 37460 |
| Sep-08 | 57385 | 18134 | 39251 |
| Dec-08 | 57933 | 18289 | 39644 |
| Mar-09 | 55690 | 18486 | 37204 |
| Jun-09 | 50969 | 19013 | 31956 |
| Sep-09 | 46272 | 19662 | 26610 |
| Dec-09 | 42486 | 20334 | 22152 |
| Mar-10 | 41281 | 20926 | 20355 |
| Jun-10 | 42906 | 21205 | 21701 |
| Sep-10 | 45972 | 21370 | 24602 |
| Dec-10 | 49193 | 21069 | 28124 |
| Mar-11 | 53719 | 20778 | 32941 |
| Jun-11 | 57571 | 20173 | 37398 |
| Sep-11 | 60075 | 19608 | 40467 |
| Dec-11 | 61830 | 19355 | 42475 |
| Mar-12 | 62688 | 19202 | 43486 |
| Jun-12 | 62832 | 19435 | 43397 |
| Sep-12 | 62579 | 20041 | 42538 |
| Dec-12 | 61785 | 21322 | 40463 |
| Mar-13 | 59156 | 22630 | 36526 |
| Jun-13 | 55357 | 24329 | 31028 |
| Sep-13 | 51159 | 26409 | 24750 |
| Dec-13 | 46962 | 28563 | 18399 |
| Mar-14 | 42233 | 30061 | 12172 |
| Jun-14 | 38965 | 30713 | 8252 |
| Sep-14 | 36925 | 31221 | 5704 |
| Dec-14 | 35327 | 31983 | 3344 |
| Mar-15 | 34419 | 32447 | 1972 |
| Jun-15 | 33857 | 32907 | 950 |
| Sep-15 | 33571 | 33289 | 282 |
| Dec-15 | 33718 | 33644 | 74 |
| Mar-16 | 34439 | 34105 | 334 |
| Jun-16 | 35825 | 33881 | 1944 |
| Sep-16 | 37039 | 33562 | 3477 |
| Dec-16 | 37081 | 33142 | 3939 |
| Mar-17 | 35892 | 32337 | 3555 |
| Jun-17 | 34459 | 32029 | 2430 |
| Sep-17 | 33236 | 31290 | 1946 |
| Dec-17 | 32392 | 30410 | 1982 |
| Mar-18 | 32063 | 29674 | 2389 |
| Jun-18 | 31845 | 28921 | 2924 |
| Sep-18 | 31755 | 28525 | 3230 |
| Dec-18 | 31530 | 27637 | 3893 |
| Mar-19 | 31456 | 27621 | 3835 |
| Jun-19 | 31266 | 27623 | 3643 |
Large net gains from the rest of the world
The implied migrant flows with the rest of the world, excluding Australia, can be derived by subtracting the trans-Tasman flows from New Zealand’s total migrant flows. These indicate significant inflows and net migration gains from the rest of the world combined.
In the year ended June 2019, the net migration gain from the rest of the world (excluding Australia) was 50,900. This is down from the highest-ever annual net inflow of 66,600 in the year ended September 2016. The recent upturn in migrant departures to the rest of the world will partly reflect the increased migrant arrivals from 2014, many of whom were on temporary visas such as work, student, and visitor visas, and are now departing.
| Rolling year ended | Migration from rest of the world (excluding Australia) to New Zealand | Migration from New Zealand to rest of world (excluding Australia) | Net migration from rest of the world (excluding Australia) to New Zealand |
| Sep-04 | 84366 | 44777 | 39589 |
| Dec-04 | 82926 | 49497 | 33429 |
| Mar-05 | 82357 | 50990 | 31367 |
| Jun-05 | 83968 | 50720 | 33248 |
| Sep-05 | 84561 | 50801 | 33760 |
| Dec-05 | 84974 | 49380 | 35594 |
| Mar-06 | 86392 | 48337 | 38055 |
| Jun-06 | 86873 | 48687 | 38186 |
| Sep-06 | 89391 | 48497 | 40894 |
| Dec-06 | 91808 | 48529 | 43279 |
| Mar-07 | 93631 | 49336 | 44295 |
| Jun-07 | 94538 | 49504 | 45034 |
| Sep-07 | 95059 | 50096 | 44963 |
| Dec-07 | 94692 | 50267 | 44425 |
| Mar-08 | 96239 | 50036 | 46203 |
| Jun-08 | 99398 | 50092 | 49306 |
| Sep-08 | 101308 | 49908 | 51400 |
| Dec-08 | 101965 | 50175 | 51790 |
| Mar-09 | 101221 | 50006 | 51215 |
| Jun-09 | 96939 | 48795 | 48144 |
| Sep-09 | 92765 | 48442 | 44323 |
| Dec-09 | 88027 | 47802 | 40225 |
| Mar-10 | 83378 | 48544 | 34834 |
| Jun-10 | 80581 | 49989 | 30592 |
| Sep-10 | 79911 | 50475 | 29436 |
| Dec-10 | 79576 | 51583 | 27993 |
| Mar-11 | 80004 | 52416 | 27588 |
| Jun-11 | 80853 | 52728 | 28125 |
| Sep-11 | 81458 | 53520 | 27938 |
| Dec-11 | 80900 | 54364 | 26536 |
| Mar-12 | 81631 | 53461 | 28170 |
| Jun-12 | 81531 | 52632 | 28899 |
| Sep-12 | 80346 | 51604 | 28742 |
| Dec-12 | 80814 | 50449 | 30365 |
| Mar-13 | 80232 | 49434 | 30798 |
| Jun-13 | 81993 | 50136 | 31857 |
| Sep-13 | 83027 | 50079 | 32948 |
| Dec-13 | 84833 | 49122 | 35711 |
| Mar-14 | 87965 | 49109 | 38856 |
| Jun-14 | 89825 | 48517 | 41308 |
| Sep-14 | 95562 | 48172 | 47390 |
| Dec-14 | 98124 | 48117 | 50007 |
| Mar-15 | 101590 | 49063 | 52527 |
| Jun-15 | 103037 | 49398 | 53639 |
| Sep-15 | 105486 | 49467 | 56019 |
| Dec-15 | 108520 | 49394 | 59126 |
| Mar-16 | 110753 | 48036 | 62717 |
| Jun-16 | 112455 | 46663 | 65792 |
| Sep-16 | 112221 | 45670 | 66551 |
| Dec-16 | 112319 | 46302 | 66017 |
| Mar-17 | 112688 | 48704 | 63984 |
| Jun-17 | 112725 | 51789 | 60936 |
| Sep-17 | 112922 | 55331 | 57591 |
| Dec-17 | 112670 | 58139 | 54531 |
| Mar-18 | 112493 | 59788 | 52705 |
| Jun-18 | 112029 | 60484 | 51545 |
| Sep-18 | 112839 | 60349 | 52490 |
| Dec-18 | 112782 | 59508 | 53274 |
| Mar-19 | 111176 | 59004 | 52172 |
| Jun-19 | 110031 | 59113 | 50918 |
Summary
Trans-Tasman flows continue to be an important feature of New Zealand’s migration balance. However, current departures to Australia, and resulting net migration, are relatively low by historical standards.
Trans-Tasman flows are dominated by the movement of New Zealand citizens in both directions. In contrast, migration between New Zealand and the rest of the world is dominated by non-New Zealand citizens in both directions.
Text alternative for Estimated migration, year ended June 2019.
Country of last previous residence
The country of last previous residence (CLPR) of migrants arriving in New Zealand and Australia is not always known. The estimates presented here make an allowance for non-response to the CLPR on both New Zealand and Australian arrival cards based on the observed relationship between citizenship, birthplace, and CLPR. These estimates may differ from data published elsewhere (for example, Infoshare) which make no adjustment for CLPR non-response.
During the December 2003-June 2019 quarters, migrant arrivals into Australia averaged 460,000 a year and an average of 9 percent did not have an identifiable CLPR. Adjusting for non-response increased the number of migrant arrivals into Australia from New Zealand by an average of 14,000 a year compared with the unadjusted data.
New Infoshare data series
The new migration series is freely available in Infoshare: Estimated migrant arrivals to Australia by CLPR, citizenship and birthplace. From the Infoshare home page, select ‘Tourism’, then ‘International Travel and Migration’.
Quarterly and rolling year-ended series will be updated about six months after the end of each quarter, using data supplied by the ABS. ABS migration estimates using the outcomes-based approach are available quarterly from December quarter 2003. As with Stats NZ migration data, the initial ABS migration data are provisional and subject to revision until finalised about 17 months after the reference period.
Backdoor migration into Australia
New Zealand has sometimes been used as an indirect or ‘backdoor’ gateway into Australia, especially in the early 2000s . In early 2001, departures from New Zealand to Australia spiked; and of New Zealand citizens who migrated to Australia, 1 in 3 were born outside of New Zealand. The ABS data gives further insight into these migrant flows, which suggest the overseas-born proportion has been about 1 in 3 during 2017-19. This is slightly higher than the overseas-born share of New Zealand’s population, which increased from 19.5 percent in 2001 to 27.4 percent in 2018 .
Revisions
All migration estimates presented here for periods after June 2018 are provisional and subject to revision.
International migration releases
International migration – publications provides links to monthly international migration releases.
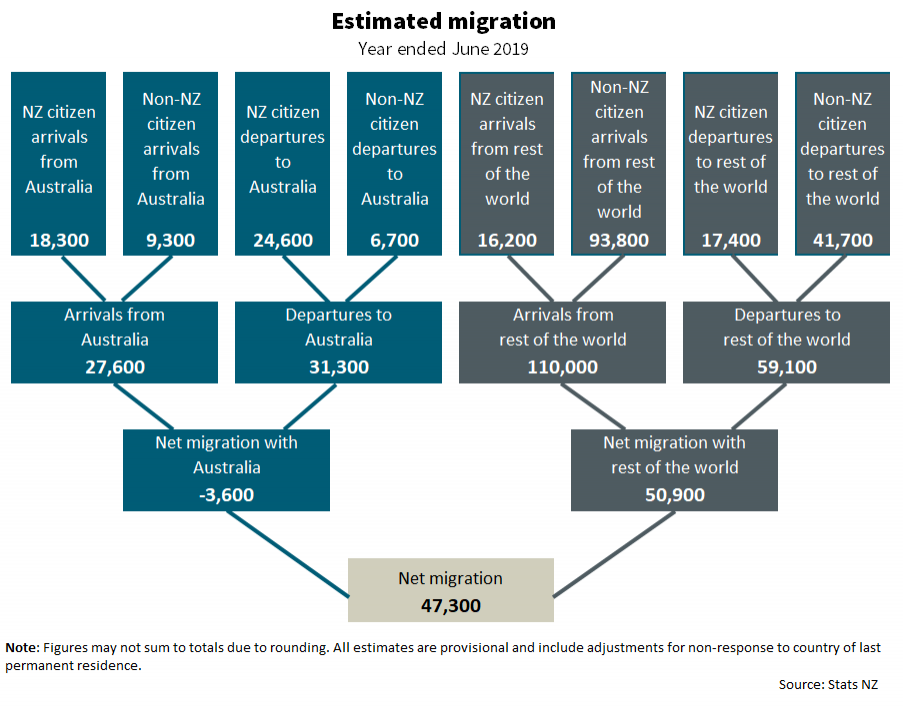
Text alternative for Estimated migration, year ended June 2019
Diagram shows estimates of migrant arrivals, migrant departures, and net migration for the year ended June 2019. Arrivals of New Zealand citizens from Australia were 18,300. Arrivals of non-New Zealand citizens from Australia were 9,300. Departures of New Zealand citizens to Australia were 24,600. Departures of non-New Zealand citizens to Australia were 6,700. Arrivals of New Zealand citizens from rest of the world were 16,200. Arrivals of non-New Zealand citizens from rest of the world were 93,800. Departures of New Zealand citizens to rest of the world were 17,400. Departures of non-New Zealand citizens to rest of the world were 41,700. Arrivals from Australia were 27,600. Departures to Australia were 31,300. Arrivals from rest of the world were 110,000. Departures to rest of the world were 59,100. Net migration with Australia was -3,600. Net migration with rest of the world was 50,900. Result is a total net migration gain of 47,300. Note: Figures may not sum to totals due to rounding. All estimates are provisional, subject to revision, and include adjustments for non-response to country of last permanent residence.


