New Zealand’s resident population provisionally reached 5 million in March 2020, Stats NZ said today.
“This is a significant event for New Zealand,” population insights senior manager Brooke Theyers said.
“It is also the fastest million in our history, taking 17 years after reaching 4 million in 2003.”
A precise date for the milestone will be available after the population estimates are revised to fully incorporate 2018 Census and census coverage results later in 2020, as well as revisions to international migration estimates. This could see the milestone date move slightly earlier or later than March 2020.
“It is most likely the 5 million milestone was reached by a migrant arriving by plane, but could have been reached by a newborn baby.”
The estimated resident population is provisionally 5,002,100 at 31 March 2020.
Stats NZ previously indicated that the 5 million mark would be likely reached in 2020 .
Text alternative for graph of New Zealand resident population, 1900-2020
Recent migration tips population past 5 million
Population growth has been significant since 2013, with half a million people added to the population over the last six years. On average, the population has grown by 1.8 percent a year since 2013, driven by net migration.
“The global COVID-19 pandemic has caused unusual international travel and migration patterns in recent months,” said Mrs Theyers.
“Net migration has been boosted by more New Zealand citizens returning home after living overseas.”
“At the same time, New Zealand citizens may have been unable or reluctant to head offshore.”
The migration estimates are subject to revision, especially if recent migrant arrivals head back overseas once border restrictions are relaxed and international travel resumes . Any revisions to migration estimates will also cause revisions to population estimates.
How we got there
About half of the population growth from 4 to 5 million (between 2003 and 2020) was due to natural increase (births minus deaths), and about half from net migration (migrant arrivals minus migrant departures).
“International migration played a significant role in reaching the 5 million milestone,” Mrs Theyers said.
“Migration was also significant in reaching 1 million in 1908.”
During the 20th century, natural increase was the main factor growing New Zealand’s population. However, net migration has been the dominant factor at different times such as during the early 1970s, mid-1990s, early 2000s, and late 2010s.
| December year | Natural increase | Net migration | Total population growth |
| 1900 | 12695 | 1831 | 14526 |
| 1901 | 13258 | 6522 | 19780 |
| 1902 | 12739 | 7992 | 20731 |
| 1903 | 13880 | 11275 | 25155 |
| 1904 | 15293 | 10355 | 25648 |
| 1905 | 16261 | 9302 | 25563 |
| 1906 | 16580 | 12848 | 29428 |
| 1907 | 15716 | 5730 | 21446 |
| 1908 | 17604 | 14261 | 31865 |
| 1909 | 18286 | 4719 | 23005 |
| 1910 | 17084 | 3408 | 20492 |
| 1911 | 17574 | 4200 | 21774 |
| 1912 | 19074 | 8927 | 28001 |
| 1913 | 18623 | 14219 | 32842 |
| 1914 | 19010 | 5140 | 24150 |
| 1915 | 16057 | 3075 | 19132 |
| 1916 | 15673 | 636 | 16309 |
| 1917 | 13449 | 1780 | 15229 |
| 1918 | 4277 | 246 | 4523 |
| 1919 | 13962 | 1054 | 15016 |
| 1920 | 18651 | 11138 | 29789 |
| 1921 | 18837 | 13323 | 32160 |
| 1922 | 19141 | 6844 | 25985 |
| 1923 | 17608 | 6820 | 24428 |
| 1924 | 18446 | 9222 | 27668 |
| 1925 | 18376 | 12674 | 31050 |
| 1926 | 17954 | 11860 | 29814 |
| 1927 | 17632 | 2428 | 20060 |
| 1928 | 16803 | 443 | 17246 |
| 1929 | 15917 | 2796 | 18713 |
| 1930 | 16183 | 4238 | 20421 |
| 1931 | 16259 | -1409 | 14850 |
| 1932 | 14893 | -3331 | 11562 |
| 1933 | 14474 | -2391 | 12083 |
| 1934 | 13767 | -3386 | 10381 |
| 1935 | 13855 | -1241 | 12614 |
| 1936 | 13863 | 235 | 14098 |
| 1937 | 14819 | 1957 | 16776 |
| 1938 | 14137 | 2095 | 16232 |
| 1939 | 17026 | 6917 | 23943 |
| 1940 | 21101 | 1399 | 22500 |
| 1941 | 19562 | 191 | 19753 |
| 1942 | 16926 | 724 | 17650 |
| 1943 | 15678 | 295 | 15973 |
| 1944 | 18729 | 1368 | 20097 |
| 1945 | 23034 | -774 | 22260 |
| 1946 | 28835 | 5277 | 34112 |
| 1947 | 32283 | 3756 | 36039 |
| 1948 | 31940 | 4462 | 36402 |
| 1949 | 31269 | 8011 | 39280 |
| 1950 | 31251 | 7976 | 39227 |
| 1951 | 31540 | 12407 | 43947 |
| 1952 | 32879 | 22033 | 54912 |
| 1953 | 33646 | 17511 | 51157 |
| 1954 | 35514 | 7455 | 42969 |
| 1955 | 36434 | 9176 | 45610 |
| 1956 | 37553 | 10201 | 47754 |
| 1957 | 37485 | 16532 | 54017 |
| 1958 | 40130 | 10609 | 50739 |
| 1959 | 40769 | 5063 | 45832 |
| 1960 | 42454 | 950 | 43404 |
| 1961 | 43663 | 15510 | 59173 |
| 1962 | 43098 | 14871 | 57969 |
| 1963 | 41661 | 13327 | 54988 |
| 1964 | 39516 | 12186 | 51702 |
| 1965 | 37215 | 11955 | 49170 |
| 1966 | 36541 | 13338 | 49879 |
| 1967 | 38278 | -1155 | 37123 |
| 1968 | 37766 | -8294 | 29472 |
| 1969 | 38597 | -5884 | 32713 |
| 1970 | 37502 | 8359 | 45861 |
| 1971 | 40261 | 9526 | 49787 |
| 1972 | 38084 | 21709 | 59793 |
| 1973 | 35501 | 30850 | 66351 |
| 1974 | 34434 | 33809 | 68243 |
| 1975 | 31527 | 19914 | 51441 |
| 1976 | 30016 | -12028 | 17988 |
| 1977 | 28109 | -25784 | 2325 |
| 1978 | 27479 | -26032 | 1447 |
| 1979 | 26762 | -26321 | 441 |
| 1980 | 24694 | -11642 | 13052 |
| 1981 | 25571 | -6691 | 18880 |
| 1982 | 24750 | 10777 | 35527 |
| 1983 | 24953 | 14612 | 39565 |
| 1984 | 26103 | 3885 | 29988 |
| 1985 | 25048 | -12896 | 12152 |
| 1986 | 26458 | -11455 | 15003 |
| 1987 | 28459 | 4613 | 33072 |
| 1988 | 30284 | -23045 | 7239 |
| 1989 | 31675 | -2684 | 28991 |
| 1990 | 33927 | 10862 | 44789 |
| 1991 | 34604 | 6512 | 41116 |
| 1992 | 31725 | 3786 | 35511 |
| 1993 | 31693 | 7732 | 39425 |
| 1994 | 30686 | 22005 | 52691 |
| 1995 | 30187 | 36178 | 66365 |
| 1996 | 29755 | 43132 | 72887 |
| 1997 | 30355 | -3931 | 26424 |
| 1998 | 30286 | -707 | 29579 |
| 1999 | 29030 | 22892 | 51922 |
| 2000 | 31482 | -15194 | 16288 |
| 2001 | 28779 | 31122 | 59901 |
| 2002 | 27805 | 60636 | 88441 |
| 2003 | 29513 | 40953 | 70466 |
| 2004 | 29877 | 13801 | 43678 |
| 2005 | 31616 | 10984 | 42600 |
| 2006 | 32081 | 16265 | 48346 |
| 2007 | 35942 | 10651 | 46593 |
| 2008 | 35451 | 12146 | 47597 |
| 2009 | 35201 | 18073 | 53274 |
| 2010 | 36019 | -131 | 35888 |
| 2011 | 31770 | -15939 | 15831 |
| 2012 | 32253 | -10098 | 22155 |
| 2013 | 29817 | 17312 | 47129 |
| 2014 | 28235 | 46663 | 74898 |
| 2015 | 27452 | 59052 | 86504 |
| 2016 | 28639 | 62078 | 90717 |
| 2017 | 26325 | 52549 | 78874 |
| 2018 | 25928 | 49512 | 75440 |
| 2019 | 26851 | 58556 | 85407 |
Note: Natural increase is estimated births minus estimated deaths, occurring in New Zealand each year. Deaths include war deaths occurring outside of New Zealand. Net migration is total movements for 1900-2000 and estimated net migration for 2001-19. Total population growth is natural increase plus net migration; this is different from population growth derived from population estimates.
Role of migration
Migration is a two-way street – more than 1 million people born overseas now live in New Zealand, while hundreds of thousands of New Zealand-born people live overseas, especially in Australia.
“International migration has also changed the composition of our population,” Mrs Theyers said.
The 2018 Census indicated that over 27 percent of New Zealand’s population was born overseas, a proportion similar to when New Zealand reached 1 million in 1908. The Māori ethnic population has grown from 5 percent of the population (1906 Census) to 17 percent in 2018. While the population in 1908 was dominated by settlers from Europe, mainly the United Kingdom, the population in 2020 is more diverse. In addition to significant European and Māori ethnic populations, New Zealand is also home to various Asian and Pacific ethnic populations, as well as growing Middle Eastern/Latin American/African populations. See also 2018 Census data allows users to dive deep into New Zealand’s diversity.
The 5 million club
Other countries with populations between 5 and 6 million include Costa Rica, Denmark, Finland, Norway, Singapore, and the Slovak Republic.
Will we get to 6 million?
The latest national population projections (published October 2016) indicate that the resident population is likely to reach 6 million in the 2040s, but it could be earlier or later depending on birth rates, death rates and net migration. Sustained lower birth rates and an ageing population mean that the population is likely to grow at a slower pace in the future, than it has in recent decades.
New national population projections are likely to be released in late 2020 and will involve a review of fertility, mortality and migration trends over both the short-term and long-term.
How do we track the population?
We update national population estimates every quarter each year. The ‘estimated resident population’ gives the best measure of the population that usually lives in New Zealand, by age and sex. Visitors from overseas are excluded from these population estimates.
The Population clock gives a real time indication of New Zealand’s population.
The estimated resident population is based on previous census results, with allowances for residents who were missed, counted more than once, or were temporarily overseas. The figures are also updated each quarter for births, deaths, and net migration.
Population estimates are revised after a new census. The 2013-base estimates have yet to be revised following the 2018 Census because of delays to the census coverage results. Estimates of census coverage are a critical input into rebasing the population estimates, and this rebasing will occur later in 2020.
Population estimates, especially at the national level, are reasonably accurate because of the high quality of New Zealand’s demographic data. The revisions to the New Zealand population estimates after the 2013, 2006, and 2001 Censuses were, respectively:
- down 29,000 (0.7 percent)
- up 45,100 (1.1 percent)
- up 12,500 (0.3 percent).
See also How accurate are population estimates and projections?
Summary of milestones
For a summary of how the New Zealand population has changed at each million milestone, see National population estimates at 31 March 2020 – Infoshare tables.
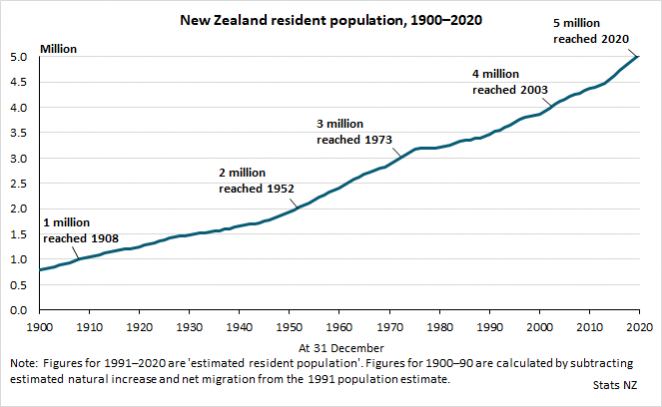
Text alternative for graph of New Zealand resident population, 1900-2020
The line graph shows New Zealand’s population increasing from 800,000 people in 1900 to five million people in 2020.
The resident population of New Zealand reached 1 million in 1908. Two million was reached in 1952, 44 years after the first million. Three million was reached in 1973, 21 years after the second million. Four million was reached in 2003, 30 years after the third million. Five million was reached in 2020, 17 years after the fourth million.
Note: Figures for 1991-2020 are estimated resident population. Figures for 1900-90 are calculated by subtracting estimated natural increase and net migration from the 1991 population estimate.


