Key labour market measures showed an increasingly tight labour market, with unemployment and underutilisation near record lows, employment at an all-time high, and wage growth strong, Stats NZ said today.
The seasonally adjusted unemployment and underutilisation rates fell to 3.4 and 9.2 percent, respectively, in the September 2021 quarter, while the employment rate rose to 68.8 percent.
The number of unemployed people fell by 18,000 over the quarter to 98,000, which, combined with 54,000 more people in employment, drove the unemployment rate down.
“The strong decline in unemployment brought the rate down to New Zealand’s lowest rate on record, matching December 2007, when it was also 3.4 percent,” work and wellbeing statistics senior manager Becky Collett said.
| Quarter | Men | Women | Total |
| Sep-06 | 3.6 | 4.2 | 3.9 |
| Dec-06 | 3.5 | 4.1 | 3.8 |
| Mar-07 | 3.6 | 4.2 | 3.9 |
| Jun-07 | 3.3 | 4 | 3.6 |
| Sep-07 | 3.2 | 3.9 | 3.6 |
| Dec-07 | 3.3 | 3.4 | 3.4 |
| Mar-08 | 3.6 | 4 | 3.8 |
| Jun-08 | 3.8 | 3.8 | 3.8 |
| Sep-08 | 4.1 | 4 | 4.1 |
| Dec-08 | 4.3 | 4.6 | 4.4 |
| Mar-09 | 5.1 | 4.9 | 5 |
| Jun-09 | 5.6 | 6 | 5.8 |
| Sep-09 | 6.3 | 6 | 6.2 |
| Dec-09 | 6.6 | 6.5 | 6.6 |
| Mar-10 | 5.6 | 6.3 | 5.9 |
| Jun-10 | 6.7 | 6.5 | 6.6 |
| Sep-10 | 5.6 | 6.6 | 6.1 |
| Dec-10 | 6 | 6.5 | 6.2 |
| Mar-11 | 5.7 | 6.4 | 6 |
| Jun-11 | 6 | 6.1 | 6.1 |
| Sep-11 | 5.6 | 6.3 | 6 |
| Dec-11 | 6.1 | 6 | 6.1 |
| Mar-12 | 6.1 | 6.7 | 6.4 |
| Jun-12 | 6.2 | 6.7 | 6.4 |
| Sep-12 | 6.6 | 6.9 | 6.7 |
| Dec-12 | 6 | 6.7 | 6.3 |
| Mar-13 | 5.2 | 6.5 | 5.8 |
| Jun-13 | 5.5 | 6.5 | 6 |
| Sep-13 | 5.5 | 6.2 | 5.8 |
| Dec-13 | 5 | 6.4 | 5.7 |
| Mar-14 | 5.1 | 6.1 | 5.6 |
| Jun-14 | 4.6 | 6 | 5.3 |
| Sep-14 | 4.6 | 6.1 | 5.3 |
| Dec-14 | 4.8 | 6.3 | 5.5 |
| Mar-15 | 5.2 | 5.9 | 5.5 |
| Jun-15 | 4.8 | 6.3 | 5.5 |
| Sep-15 | 5.3 | 6.1 | 5.7 |
| Dec-15 | 4.7 | 5.3 | 5 |
| Mar-16 | 5 | 5.6 | 5.3 |
| Jun-16 | 4.7 | 5.5 | 5.1 |
| Sep-16 | 4.7 | 5.3 | 5 |
| Dec-16 | 4.8 | 5.8 | 5.3 |
| Mar-17 | 4.3 | 5.6 | 4.9 |
| Jun-17 | 4.8 | 4.9 | 4.8 |
| Sep-17 | 4.1 | 5.4 | 4.8 |
| Dec-17 | 4 | 5 | 4.5 |
| Mar-18 | 3.9 | 4.8 | 4.4 |
| Jun-18 | 4.4 | 4.8 | 4.6 |
| Sep-18 | 4 | 4 | 4 |
| Dec-18 | 4.4 | 4.2 | 4.3 |
| Mar-19 | 3.8 | 4.5 | 4.2 |
| Jun-19 | 3.8 | 4.4 | 4 |
| Sep-19 | 3.8 | 4.5 | 4.2 |
| Dec-19 | 3.8 | 4.3 | 4 |
| Mar-20 | 4 | 4.4 | 4.2 |
| Jun-20 | 3.7 | 4.6 | 4.1 |
| Sep-20 | 4.8 | 5.8 | 5.3 |
| Dec-20 | 4.5 | 5.3 | 4.8 |
| Mar-21 | 4.6 | 4.6 | 4.6 |
| Jun-21 | 3.8 | 4.2 | 4 |
| Sep-21 | 3.3 | 3.4 | 3.4 |
Spare labour market capacity decreases
Following the most recent peak of 5.3 percent in the September 2020 quarter, New Zealand’s unemployment rate has since fallen sharply throughout 2021.
“The fall in the unemployment rate is in line with reports of difficulty finding workers and high labour turnover, and continued travel restrictions on international arrivals, which put pressure on domestic labour supply,” Ms Collett said.
Similarly, underutilisation, which is a broader gauge of spare labour market capacity, fell to 9.2 percent from 10.5 percent last quarter. As with unemployment, this has now reached lows last recorded in the December 2007 quarter.
In addition to people who are unemployed, underutilisation includes people underemployed (those who are employed part-time yet want and are available for more work) and people who want jobs but are either unavailable to work or not actively seeking work (the potential labour force).
| Quarter | Persons underemployed | Persons officially unemployed | Total potential labour force |
| Sep-16 | 113000 | 132000 | 103000 |
| Dec-16 | 108000 | 141000 | 95000 |
| Mar-17 | 110000 | 132000 | 100000 |
| Jun-17 | 104000 | 130000 | 100000 |
| Sep-17 | 115000 | 130000 | 98000 |
| Dec-17 | 123000 | 123000 | 100000 |
| Mar-18 | 115000 | 120000 | 106000 |
| Jun-18 | 117000 | 127000 | 104000 |
| Sep-18 | 110000 | 112000 | 107000 |
| Dec-18 | 120000 | 121000 | 113000 |
| Mar-19 | 104000 | 116000 | 107000 |
| Jun-19 | 110000 | 113000 | 99000 |
| Sep-19 | 93000 | 118000 | 91000 |
| Dec-19 | 92000 | 114000 | 87000 |
| Mar-20 | 92000 | 120000 | 95000 |
| Jun-20 | 127000 | 116000 | 113000 |
| Sep-20 | 134000 | 151000 | 106000 |
| Dec-20 | 116000 | 139000 | 96000 |
| Mar-21 | 123000 | 133000 | 106000 |
| Jun-21 | 107000 | 116000 | 91000 |
| Sep-21 | 97000 | 98000 | 84000 |
In the September 2021 quarter, the number of underutilised people fell by 36,000 to 278,000. Around half of this fall came from unemployment.
“This was the third quarter in the last year with unusually strong falls, after last September quarter’s peak, which led to a record annual drop,” Ms Collett said.
The number of underutilised people decreased by 113,000, or 28.9 percent, over the year.
Declines were much stronger for women than men in each aspect of underutilisation, leading to a noticeably sharper fall in their underutilisation rate. However, the underutilisation rate for men remained lower than that for women this quarter, at 7.7 percent compared with 10.9 percent.
| Quarter | Men | Women | Total |
| Mar-04 | 8.1 | 13.6 | 10.7 |
| Jun-04 | 7.6 | 12.8 | 10 |
| Sep-04 | 7.6 | 12.6 | 9.9 |
| Dec-04 | 7.6 | 12.5 | 9.9 |
| Mar-05 | 7.4 | 11.7 | 9.4 |
| Jun-05 | 7.7 | 11.8 | 9.6 |
| Sep-05 | 7.3 | 11.2 | 9.1 |
| Dec-05 | 7 | 11.9 | 9.3 |
| Mar-06 | 7.3 | 10.8 | 9 |
| Jun-06 | 7.2 | 10.3 | 8.6 |
| Sep-06 | 7.2 | 10.7 | 8.8 |
| Dec-06 | 8.3 | 12.7 | 10.4 |
| Mar-07 | 8 | 12 | 9.9 |
| Jun-07 | 7.3 | 12.6 | 9.8 |
| Sep-07 | 7.3 | 11 | 9 |
| Dec-07 | 7.5 | 11.1 | 9.2 |
| Mar-08 | 8.4 | 12.3 | 10.3 |
| Jun-08 | 8.5 | 11.7 | 10 |
| Sep-08 | 8.6 | 12.6 | 10.5 |
| Dec-08 | 9.3 | 13.6 | 11.3 |
| Mar-09 | 10.5 | 14.3 | 12.3 |
| Jun-09 | 11.8 | 15.8 | 13.7 |
| Sep-09 | 13 | 16.8 | 14.8 |
| Dec-09 | 12.8 | 17.5 | 15 |
| Mar-10 | 11.6 | 15.8 | 13.6 |
| Jun-10 | 12.3 | 16.2 | 14.2 |
| Sep-10 | 11.5 | 16.5 | 13.9 |
| Dec-10 | 11.6 | 16.5 | 14 |
| Mar-11 | 11.4 | 16.9 | 14 |
| Jun-11 | 12.1 | 16.3 | 14.1 |
| Sep-11 | 11.1 | 16.4 | 13.6 |
| Dec-11 | 12.1 | 15.5 | 13.7 |
| Mar-12 | 11.7 | 16.8 | 14.1 |
| Jun-12 | 11.9 | 17.8 | 14.7 |
| Sep-12 | 13.5 | 17.7 | 15.6 |
| Dec-12 | 12.4 | 17.3 | 14.7 |
| Mar-13 | 10.4 | 15.9 | 13 |
| Jun-13 | 10.6 | 16.2 | 13.3 |
| Sep-13 | 11.1 | 17.3 | 14.1 |
| Dec-13 | 11.1 | 17.1 | 14 |
| Mar-14 | 10.9 | 15.8 | 13.2 |
| Jun-14 | 10.5 | 16.4 | 13.3 |
| Sep-14 | 10.2 | 15.6 | 12.8 |
| Dec-14 | 10.5 | 16.4 | 13.3 |
| Mar-15 | 10.8 | 16.6 | 13.6 |
| Jun-15 | 10.6 | 16.8 | 13.6 |
| Sep-15 | 11.2 | 16.5 | 13.7 |
| Dec-15 | 10.1 | 15 | 12.5 |
| Mar-16 | 11.2 | 16.3 | 13.7 |
| Jun-16 | 10.5 | 15.9 | 13.1 |
| Sep-16 | 10 | 15.6 | 12.7 |
| Dec-16 | 9.7 | 15.4 | 12.4 |
| Mar-17 | 9.3 | 15.5 | 12.2 |
| Jun-17 | 9.5 | 14.7 | 12 |
| Sep-17 | 9.3 | 15.3 | 12.1 |
| Dec-17 | 9.4 | 15.3 | 12.2 |
| Mar-18 | 9.5 | 14.6 | 11.9 |
| Jun-18 | 9.9 | 14.5 | 12.1 |
| Sep-18 | 9.3 | 13.7 | 11.4 |
| Dec-18 | 9.9 | 14.6 | 12.1 |
| Mar-19 | 9 | 13.8 | 11.3 |
| Jun-19 | 9.2 | 13.2 | 11.1 |
| Sep-19 | 8.4 | 12.6 | 10.4 |
| Dec-19 | 8.4 | 11.9 | 10 |
| Mar-20 | 8.3 | 12.7 | 10.4 |
| Jun-20 | 9.4 | 15 | 12.1 |
| Sep-20 | 10.5 | 16.1 | 13.2 |
| Dec-20 | 9.7 | 14.2 | 11.8 |
| Mar-21 | 9.9 | 14.6 | 12.1 |
| Jun-21 | 8.3 | 13 | 10.5 |
| Sep-21 | 7.7 | 10.9 | 9.2 |
“As we’re seeing shrinking spare capacity in the labour market with fewer people underutilised, the unemployment rate is almost even between men and women, and more women are returning to or entering the labour force,” Ms Collett said.
Employment up
Seasonally adjusted employment rose 2.0 percent to 2,830,000 in the September 2021 quarter. This quarterly increase came primarily from women (up 39,000, or 3.0 percent) – the largest increase on record – with employment for men up 15,000 (1.0 percent).
“While employment growth was strong for both men and women, the number of women in employment saw the largest quarterly growth in the series,” Ms Collett said.
The employment rate for women was 64.6 percent, up from 62.8 percent last quarter. This is the highest rate ever recorded for women, up both annually following disproportionate falls in female employment in 2020 and over the two-year period since before COVID-19 first emerged.
The employment rate for men was 73.2 percent, up from 72.6 percent last quarter.
| Quarter | Men | Women | Total |
| Sep-06 | 72.8 | 58.6 | 65.5 |
| Dec-06 | 72.9 | 58.2 | 65.3 |
| Mar-07 | 72.9 | 59.2 | 65.8 |
| Jun-07 | 73 | 59.5 | 66 |
| Sep-07 | 73.2 | 58.7 | 65.7 |
| Dec-07 | 72.8 | 59.8 | 66.1 |
| Mar-08 | 72.6 | 59.5 | 65.8 |
| Jun-08 | 72.3 | 59.6 | 65.7 |
| Sep-08 | 71.8 | 59.8 | 65.6 |
| Dec-08 | 72.4 | 59.9 | 65.9 |
| Mar-09 | 70.6 | 58.8 | 64.5 |
| Jun-09 | 70.8 | 58.3 | 64.3 |
| Sep-09 | 69.2 | 58.2 | 63.5 |
| Dec-09 | 69.3 | 57.8 | 63.3 |
| Mar-10 | 69.6 | 57.6 | 63.4 |
| Jun-10 | 69.3 | 57.6 | 63.3 |
| Sep-10 | 70.3 | 57.6 | 63.7 |
| Dec-10 | 69.4 | 57.5 | 63.3 |
| Mar-11 | 69.9 | 58.1 | 63.8 |
| Jun-11 | 69.7 | 58.3 | 63.8 |
| Sep-11 | 70.1 | 58.1 | 63.9 |
| Dec-11 | 69.6 | 58.2 | 63.7 |
| Mar-12 | 69.8 | 58.1 | 63.7 |
| Jun-12 | 69.2 | 58.4 | 63.6 |
| Sep-12 | 68.7 | 58.3 | 63.3 |
| Dec-12 | 68.7 | 58.1 | 63.3 |
| Mar-13 | 68.9 | 58.1 | 63.3 |
| Jun-13 | 69.1 | 58.1 | 63.4 |
| Sep-13 | 69.9 | 58.8 | 64.1 |
| Dec-13 | 70.4 | 58.8 | 64.4 |
| Mar-14 | 70.6 | 59.3 | 64.8 |
| Jun-14 | 70.8 | 58.9 | 64.7 |
| Sep-14 | 70.6 | 59.6 | 64.9 |
| Dec-14 | 71.1 | 60.2 | 65.5 |
| Mar-15 | 71.2 | 60.2 | 65.6 |
| Jun-15 | 71.1 | 59.7 | 65.2 |
| Sep-15 | 70.1 | 59.2 | 64.5 |
| Dec-15 | 70.6 | 59.6 | 65 |
| Mar-16 | 70.7 | 60.2 | 65.3 |
| Jun-16 | 71.9 | 61.2 | 66.4 |
| Sep-16 | 72.4 | 61.1 | 66.6 |
| Dec-16 | 72.6 | 61.7 | 67 |
| Mar-17 | 73.2 | 61.8 | 67.4 |
| Jun-17 | 72.6 | 61.4 | 66.9 |
| Sep-17 | 73.5 | 62.4 | 67.9 |
| Dec-17 | 73.6 | 62.7 | 68 |
| Mar-18 | 73.3 | 62.8 | 68 |
| Jun-18 | 73.1 | 62.8 | 67.9 |
| Sep-18 | 73.2 | 63.4 | 68.3 |
| Dec-18 | 72.7 | 63.2 | 67.9 |
| Mar-19 | 72.5 | 62.9 | 67.6 |
| Jun-19 | 72.5 | 63 | 67.7 |
| Sep-19 | 72.6 | 63 | 67.7 |
| Dec-19 | 72.6 | 62.7 | 67.6 |
| Mar-20 | 72.8 | 62.8 | 67.7 |
| Jun-20 | 72.3 | 61.9 | 67 |
| Sep-20 | 71.8 | 61.2 | 66.4 |
| Dec-20 | 72.1 | 61.7 | 66.8 |
| Mar-21 | 72.1 | 62.3 | 67.1 |
| Jun-21 | 72.6 | 62.8 | 67.6 |
| Sep-21 | 73.2 | 64.6 | 68.8 |
Growth in employment was driven by full-time and permanent employment. Annually, the construction industry remained a strong driver, and quarterly growth in the professionals occupation group was strong. This group includes health professionals and design, engineering, science, and transport professionals, where increases were predominantly led by women.
Related data sources, like the monthly employment indicators validate this . In the year to the month of September 2021, seasonally adjusted filled jobs have increased around 4.1 percent (up 88,900), with construction and healthcare and social assistance reporting some of the biggest increases.
With the second half of the September 2021 quarter affected by stricter lockdown restrictions, actual hours worked as recorded in the Household Labour Force Survey (HLFS) dropped 6.6 percent over the quarter, as industries like accommodation and food services and retail trade, manufacturing, and construction were less able to operate.
Wage growth indicating pressure to keep workers
The labour cost index (LCI) salary and wage rates (including overtime) increased 2.4 percent in the year to the September 2021 quarter, while the unadjusted LCI increased 3.8 percent.
“Within the LCI, there were a greater number of jobs getting large pay increases as businesses attempted to attract and retain staff in an increasingly tight labour market,” Ms Collett said.
The strongest contributors to the index’s annual growth this quarter were construction, education and training, and healthcare and social assistance. Also, many public sector collective employment agreements currently in place will continue to affect annual wage inflation throughout 2021 and 2022.
Average ordinary time hourly earnings, as measured by the Quarterly Employment Survey (QES), increased 3.5 percent over the year to reach $35.25.
| Quarter | LCI adjusted | LCI unadjusted | QES ordinary time hourly |
| Sep-01 | 2 | 4.2 | 3.4 |
| Dec-01 | 2.2 | 4.2 | 3.5 |
| Mar-02 | 2.1 | 3.9 | 3.7 |
| Jun-02 | 2.1 | 3.7 | 2.5 |
| Sep-02 | 2.3 | 3.6 | 3.2 |
| Dec-02 | 2.1 | 3.9 | 3.5 |
| Mar-03 | 2.3 | 4.2 | 2.3 |
| Jun-03 | 2.3 | 4.4 | 3.7 |
| Sep-03 | 2.3 | 4.4 | 3.1 |
| Dec-03 | 2.3 | 4.3 | 3.4 |
| Mar-04 | 2.2 | 4.2 | 3.5 |
| Jun-04 | 2.3 | 4.3 | 4.4 |
| Sep-04 | 2.2 | 4.5 | 3.4 |
| Dec-04 | 2.5 | 4.8 | 2.1 |
| Mar-05 | 2.5 | 4.7 | 3.6 |
| Jun-05 | 2.6 | 4.9 | 3.6 |
| Sep-05 | 3.1 | 5.4 | 4.5 |
| Dec-05 | 3.1 | 5.4 | 5.6 |
| Mar-06 | 3.2 | 5.7 | 5.4 |
| Jun-06 | 3.2 | 5.5 | 4.5 |
| Sep-06 | 3.2 | 5.1 | 5.1 |
| Dec-06 | 3.2 | 5 | 5.1 |
| Mar-07 | 3.2 | 4.6 | 4.7 |
| Jun-07 | 3.2 | 4.7 | 4.4 |
| Sep-07 | 3.1 | 4.6 | 4 |
| Dec-07 | 3.2 | 4.9 | 4.3 |
| Mar-08 | 3.4 | 5.3 | 4.7 |
| Jun-08 | 3.6 | 5.4 | 5.3 |
| Sep-08 | 3.9 | 5.6 | 5.6 |
| Dec-08 | 3.6 | 5.6 | 5.5 |
| Mar-09 | 3.4 | 5.2 | 5.4 |
| Jun-09 | 2.9 | 4.6 | 4.7 |
| Sep-09 | 2.1 | 3.8 | 3.5 |
| Dec-09 | 1.8 | 2.9 | 2.9 |
| Mar-10 | 1.5 | 2.5 | 1 |
| Jun-10 | 1.6 | 2.9 | 1.4 |
| Sep-10 | 1.6 | 3.1 | 2 |
| Dec-10 | 1.7 | 3.6 | 1.9 |
| Mar-11 | 1.8 | 3.6 | 3.1 |
| Jun-11 | 1.9 | 3.4 | 2.8 |
| Sep-11 | 2 | 3.3 | 3 |
| Dec-11 | 2 | 3.2 | 3.1 |
| Mar-12 | 2 | 3.3 | 3.2 |
| Jun-12 | 2 | 3.4 | 2.6 |
| Sep-12 | 1.9 | 3.2 | 2.9 |
| Dec-12 | 1.8 | 3 | 2.4 |
| Mar-13 | 1.8 | 3 | 2.4 |
| Jun-13 | 1.7 | 2.8 | 2.8 |
| Sep-13 | 1.6 | 3.1 | 2.6 |
| Dec-13 | 1.6 | 3 | 2.9 |
| Mar-14 | 1.5 | 2.8 | 2.6 |
| Jun-14 | 1.6 | 2.9 | 2.2 |
| Sep-14 | 1.7 | 2.5 | 2.7 |
| Dec-14 | 1.7 | 2.6 | 3 |
| Mar-15 | 1.7 | 2.5 | 2.4 |
| Jun-15 | 1.6 | 2.5 | 2.5 |
| Sep-15 | 1.6 | 2.7 | 2.2 |
| Dec-15 | 1.5 | 2.7 | 2 |
| Mar-16 | 1.6 | 2.9 | 2.4 |
| Jun-16 | 1.5 | 2.8 | 2.4 |
| Sep-16 | 1.7 | 2.6 | 2.1 |
| Dec-16 | 1.6 | 2.8 | 1.8 |
| Mar-17 | 1.6 | 3 | 2.5 |
| Jun-17 | 1.7 | 3 | 2.5 |
| Sep-17 | 1.8 | 3.4 | 2.4 |
| Dec-17 | 1.8 | 3.3 | 3.1 |
| Mar-18 | 1.8 | 3.2 | 2.7 |
| Jun-18 | 1.9 | 3.3 | 2.9 |
| Sep-18 | 1.8 | 3.3 | 3.2 |
| Dec-18 | 1.9 | 3.3 | 3.2 |
| Mar-19 | 2 | 3.4 | 3 |
| Jun-19 | 2.1 | 3.6 | 4 |
| Sep-19 | 2.5 | 3.9 | 3.4 |
| Dec-19 | 2.6 | 3.9 | 3.3 |
| Mar-20 | 2.5 | 3.8 | 3.7 |
| Jun-20 | 2.1 | 3.1 | 3 |
| Sep-20 | 1.8 | 2.8 | 4.2 |
| Dec-20 | 1.6 | 2.5 | 4.3 |
| Mar-21 | 1.6 | 2.7 | 4 |
| Jun-21 | 2.1 | 3.4 | 4 |
| Sep-21 | 2.4 | 3.8 | 3.5 |
Annually, average weekly earnings per full-time equivalent (FTE) employee in the QES grew strongly, impacted not only by hourly earnings increases, but also differing COVID-19 impacts. This quarter, the QES reference period ended before the effects of alert level 4 could be seen, compared with the September 2020 quarter when weekly hours remained low. As a result, average weekly paid hours were up 2.5 percent annually, and average weekly earnings up 6.1 percent, to $1,367.
New Zealand unemployment rate among lowest in OECD countries
With an unemployment rate of 3.4 percent, New Zealand was ranked fifth equal among 38 OECD countries in the September 2021 quarter, moving up from eighth place last quarter. In 2019, New Zealand’s unemployment ranking ranged between 13th and 14th place.
Country | September 2019 quarter unemployment rate | Peak quarterly unemployment rate in 2020 for each country(3) | Latest available data(4) |
Percent | |||
New Zealand | 4.2 | 5.3 | 3.4 |
Australia | 5.2 | 7.0 | 4.6 |
Canada | 5.7 | 13.1 | 7.2 |
Euro area (19 countries) | 7.4 | 8.5 | 7.5 |
Japan | 2.3 | 3.0 | 2.8 |
OECD – total | 5.4 | 8.6 | 6.0 |
United Kingdom | 3.8 | 5.2 | 4.5 |
United States | 3.6 | 13.1 | 5.1 |
| |||
New Zealand’s employment rate for people aged 15-64 years old was 79.1 percent, placing them third among OECD rankings, the same as last quarter. In 2019, New Zealand’s employment rate ranked between fifth and sixth place.
Official labour market concepts and definitions have not been changed during the September 2021 quarter. This is in accordance with guidance provided by the International Labour Organization regarding collecting, measuring, and interpreting labour market data in response to COVID-19, and ensures international comparability and consistency in published estimates.
In addition, Stats NZ performed rigorous data quality checks to assess the impact of recent COVID-19 restrictions and ensure the reliability and accuracy of the estimates.
COVID-19 and labour market statistics in the September 2021 quarter has more information about how raised alert levels affected this quarter’s collection of labour market statistics.
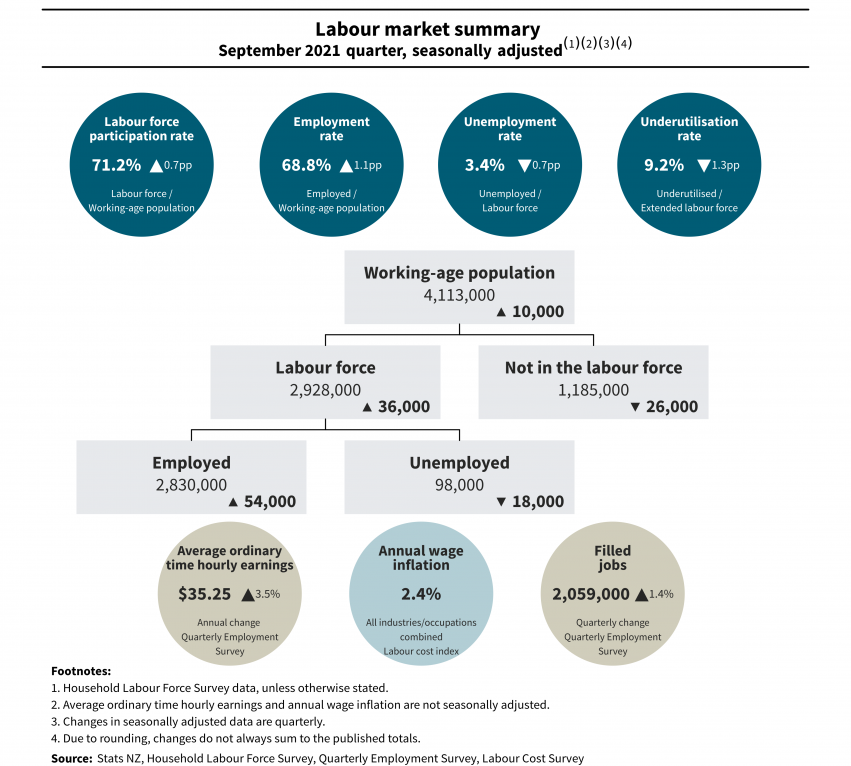
Text alternative text for labour market summary, September 2021 quarter, seasonally adjusted diagram
Diagram shows data from September 2021 quarter’s Household Labour Force Survey (HLFS), Quarterly Employment Survey (QES), and Labour Cost Index (LCI).
HLFS results for the September 2021 quarter showed the labour force participation rate was 71.2 percent, up 0.7pp (percentage points). This rate is derived from labour force divided by working-age population. The employment rate was 68.8 percent, up 1.1pp. This is derived from employed divided by working-age population. The unemployment rate was 3.4 percent, down 0.7pp. This is derived from unemployed divided by labour force. The underutilisation rate was 9.2 percent, down 1.3pp. This is derived from total underutilised divided by extended labour force.
The working-age population was up 10,000 to 4,113,000. This is made up of the labour force, up 36,000 to 2,928,000, and people not in the labour force, down 26,000 to 1,185,000. The labour force is made up of employed people, up 54,000 to 2,830,000, and those unemployed, down 18,000 to 98,000.
Average ordinary time hourly earnings from the QES were up 3.5 percent annually, to $35.25.
Annual wage inflation from the LCI was 2.4 percent, for all industries and occupations combined.
Filled jobs from the QES were up 1.4 percent for the quarter, to 2,059,000.
Notes:
- Household Labour Force Survey data, unless otherwise stated.
- Average ordinary time hourly earnings and annual wage inflation are not seasonally adjusted.
- Changes in seasonally adjusted data are quarterly.
- Due to rounding, changes do not always sum to the published totals.
Source: Stats NZ, Household Labour Force Survey, Quarterly Employment Survey, and Labour Cost Survey.


