In the September 2020 quarter, the seasonally adjusted number of unemployed people rose by 37,000 to reach 151,000, as the impact of COVID-19 hit the labour market, Stats NZ said today.
In the September 2020 quarter:
- There were 37,000 more unemployed people, an increase of 32.5 percent since the June 2020 quarter.
- Applications for the eight-week Wage Subsidy Extension were open until 1 September 2020 and until 3 September 2020 for the two-week Resurgence Wage subsidy.
- There were 22,000 fewer employed people this quarter than in the June 2020 quarter.
- The underutilisation rate rose to 13.2 percent.
- Hours worked nearly bounced back from record falls during lockdown.
- Wages showed growth this quarter.
This 37,000 rise is the largest quarterly rise in unemployment since the series began in 1986.
The next largest rise in a single quarter was recorded in the June 2009 quarter during the global financial crisis, when the number of unemployed people rose by 18,000.
| Quarter | Change |
| Mar-05 | 3000 |
| Jun-05 | -1000 |
| Sep-05 | 0 |
| Dec-05 | -1000 |
| Mar-06 | 8000 |
| Jun-06 | -8000 |
| Sep-06 | 4000 |
| Dec-06 | -2000 |
| Mar-07 | 3000 |
| Jun-07 | -6000 |
| Sep-07 | -1000 |
| Dec-07 | -4000 |
| Mar-08 | 10000 |
| Jun-08 | 1000 |
| Sep-08 | 5000 |
| Dec-08 | 9000 |
| Mar-09 | 12000 |
| Jun-09 | 18000 |
| Sep-09 | 9000 |
| Dec-09 | 9000 |
| Mar-10 | -15000 |
| Jun-10 | 16000 |
| Sep-10 | -12000 |
| Dec-10 | 4000 |
| Mar-11 | -4000 |
| Jun-11 | 1000 |
| Sep-11 | -2000 |
| Dec-11 | 2000 |
| Mar-12 | 8000 |
| Jun-12 | 1000 |
| Sep-12 | 8000 |
| Dec-12 | -10000 |
| Mar-13 | -13000 |
| Jun-13 | 5000 |
| Sep-13 | -2000 |
| Dec-13 | -2000 |
| Mar-14 | -1000 |
| Jun-14 | -9000 |
| Sep-14 | 3000 |
| Dec-14 | 7000 |
| Mar-15 | 0 |
| Jun-15 | 0 |
| Sep-15 | 3000 |
| Dec-15 | -17000 |
| Mar-16 | 10000 |
| Jun-16 | -3000 |
| Sep-16 | 0 |
| Dec-16 | 9000 |
| Mar-17 | -9000 |
| Jun-17 | -3000 |
| Sep-17 | 1000 |
| Dec-17 | -7000 |
| Mar-18 | -3000 |
| Jun-18 | 6000 |
| Sep-18 | -14000 |
| Dec-18 | 10000 |
| Mar-19 | -6000 |
| Jun-19 | -5000 |
| Sep-19 | 6000 |
| Dec-19 | -2000 |
| Mar-20 | 4000 |
| Jun-20 | -6000 |
| Sep-20 | 37000 |
“We are continuing to see the economic effects of COVID-19, and its associated border and business closures,” labour market and household statistics senior manager Sean Broughton said.
“151,000 is the highest number of unemployed people we have seen in eight years.”
Biggest quarterly growth also observed for unemployment rate
The unemployment rate rose from 4.0 percent to 5.3 percent in the September 2020 quarter. This is the biggest quarterly increase on record.
“Last quarter’s low unemployment rate of 4.0 percent was explained in part by people’s inability to be ‘actively seeking’ and available for work during the national lockdown that was in place for much of the quarter. This quarter’s increase in unemployment reflects a return to more normal job-hunting behaviours,” Mr Broughton said.
COVID-19 lockdown has widespread effects on labour market has more about last quarter’s labour market.
Over the September 2020 quarter, unemployment rates for men and women increased by similar amounts, with the women’s rate up to 5.8 percent and the men’s rate up to 4.8 percent.
| Quarter | Men | Women | Total |
| Mar-05 | 3.7 | 4.1 | 3.9 |
| Jun-05 | 3.8 | 3.9 | 3.8 |
| Sep-05 | 3.4 | 4.3 | 3.8 |
| Dec-05 | 3.2 | 4.4 | 3.7 |
| Mar-06 | 3.8 | 4.4 | 4.1 |
| Jun-06 | 3.3 | 4.1 | 3.7 |
| Sep-06 | 3.6 | 4.2 | 3.9 |
| Dec-06 | 3.5 | 4.1 | 3.8 |
| Mar-07 | 3.6 | 4.2 | 3.9 |
| Jun-07 | 3.3 | 4 | 3.6 |
| Sep-07 | 3.2 | 3.9 | 3.6 |
| Dec-07 | 3.3 | 3.4 | 3.4 |
| Mar-08 | 3.6 | 4 | 3.8 |
| Jun-08 | 3.8 | 3.8 | 3.8 |
| Sep-08 | 4.1 | 4 | 4.1 |
| Dec-08 | 4.3 | 4.6 | 4.4 |
| Mar-09 | 5.1 | 4.9 | 5 |
| Jun-09 | 5.6 | 6 | 5.8 |
| Sep-09 | 6.3 | 6 | 6.2 |
| Dec-09 | 6.6 | 6.5 | 6.6 |
| Mar-10 | 5.6 | 6.3 | 5.9 |
| Jun-10 | 6.7 | 6.5 | 6.6 |
| Sep-10 | 5.6 | 6.6 | 6.1 |
| Dec-10 | 6 | 6.5 | 6.2 |
| Mar-11 | 5.7 | 6.4 | 6 |
| Jun-11 | 6 | 6.1 | 6.1 |
| Sep-11 | 5.6 | 6.3 | 6 |
| Dec-11 | 6.1 | 6 | 6.1 |
| Mar-12 | 6.1 | 6.7 | 6.4 |
| Jun-12 | 6.2 | 6.7 | 6.4 |
| Sep-12 | 6.6 | 6.9 | 6.7 |
| Dec-12 | 6 | 6.7 | 6.3 |
| Mar-13 | 5.2 | 6.5 | 5.8 |
| Jun-13 | 5.5 | 6.5 | 6 |
| Sep-13 | 5.5 | 6.2 | 5.8 |
| Dec-13 | 5 | 6.4 | 5.7 |
| Mar-14 | 5.1 | 6.1 | 5.6 |
| Jun-14 | 4.6 | 6 | 5.3 |
| Sep-14 | 4.6 | 6.1 | 5.3 |
| Dec-14 | 4.8 | 6.3 | 5.5 |
| Mar-15 | 5.2 | 5.9 | 5.5 |
| Jun-15 | 4.8 | 6.3 | 5.5 |
| Sep-15 | 5.3 | 6.1 | 5.7 |
| Dec-15 | 4.7 | 5.3 | 5 |
| Mar-16 | 5 | 5.6 | 5.3 |
| Jun-16 | 4.7 | 5.5 | 5.1 |
| Sep-16 | 4.7 | 5.3 | 5 |
| Dec-16 | 4.8 | 5.8 | 5.3 |
| Mar-17 | 4.3 | 5.6 | 4.9 |
| Jun-17 | 4.7 | 4.9 | 4.8 |
| Sep-17 | 4.1 | 5.4 | 4.7 |
| Dec-17 | 4 | 5.1 | 4.5 |
| Mar-18 | 4 | 4.8 | 4.4 |
| Jun-18 | 4.3 | 4.8 | 4.5 |
| Sep-18 | 4 | 4 | 4 |
| Dec-18 | 4.4 | 4.3 | 4.4 |
| Mar-19 | 3.9 | 4.5 | 4.2 |
| Jun-19 | 3.7 | 4.3 | 4 |
| Sep-19 | 3.8 | 4.5 | 4.2 |
| Dec-19 | 3.9 | 4.4 | 4.1 |
| Mar-20 | 4.1 | 4.4 | 4.2 |
| Jun-20 | 3.6 | 4.5 | 4 |
| Sep-20 | 4.8 | 5.8 | 5.3 |
For much of the September 2020 quarter, Auckland was in stricter lockdown conditions than the rest of the country, at level 3 and then 2 with additional restrictions because of a new COVID-19 cluster. The number of unemployed people in Auckland rose 15,800 since last quarter, and 14,200 since the same quarter last year. Wellington and Otago also had significant annual increases in unemployment, up 6,500 and 2,900 since the September 2019 quarter, respectively.
Increased government support continues
Applications for the eight-week Wage Subsidy Extension were able to be submitted up until 1 September 2020, and applications for the two-week Resurgence Wage Subsidy were open from 21 August-3 September 2020.
At the end of September 2020, there were 204,116 people receiving a Jobseeker Support benefit, of whom 132,836 were classified as ‘Work Ready’. These numbers differ from the 151,000 unemployed people in the household labour force survey (HLFS) due to conceptual differences, seasonal adjustment, and criteria involved in the measurement of unemployment.
Conceptual differences in indicators of unemployment has more information about the differences.
Falls in employment
The seasonally adjusted number of employed people fell by 22,000 this quarter. This is the third largest quarterly fall seen in employment since the series began in 1986.
The employment rate in the September 2020 quarter was 66.4 percent, down from 67.1 percent last quarter, but it remains at relatively high levels, compared with the post global financial crisis period.
| Quarter | Men | Women | Total |
| Mar-05 | 72.2 | 57.9 | 64.8 |
| Jun-05 | 72.0 | 58.2 | 64.8 |
| Sep-05 | 72.7 | 58.7 | 65.5 |
| Dec-05 | 72.7 | 58.3 | 65.3 |
| Mar-06 | 72.8 | 58.9 | 65.6 |
| Jun-06 | 73.0 | 59.2 | 65.9 |
| Sep-06 | 72.8 | 58.6 | 65.5 |
| Dec-06 | 72.9 | 58.2 | 65.3 |
| Mar-07 | 72.9 | 59.2 | 65.8 |
| Jun-07 | 73.0 | 59.5 | 66.0 |
| Sep-07 | 73.2 | 58.7 | 65.7 |
| Dec-07 | 72.8 | 59.8 | 66.1 |
| Mar-08 | 72.6 | 59.5 | 65.8 |
| Jun-08 | 72.3 | 59.6 | 65.7 |
| Sep-08 | 71.8 | 59.8 | 65.6 |
| Dec-08 | 72.4 | 59.9 | 65.9 |
| Mar-09 | 70.6 | 58.8 | 64.5 |
| Jun-09 | 70.8 | 58.3 | 64.3 |
| Sep-09 | 69.2 | 58.2 | 63.5 |
| Dec-09 | 69.3 | 57.8 | 63.3 |
| Mar-10 | 69.6 | 57.6 | 63.4 |
| Jun-10 | 69.3 | 57.6 | 63.3 |
| Sep-10 | 70.3 | 57.6 | 63.7 |
| Dec-10 | 69.4 | 57.5 | 63.3 |
| Mar-11 | 69.9 | 58.1 | 63.8 |
| Jun-11 | 69.7 | 58.3 | 63.8 |
| Sep-11 | 70.1 | 58.0 | 63.9 |
| Dec-11 | 69.6 | 58.2 | 63.7 |
| Mar-12 | 69.8 | 58.1 | 63.7 |
| Jun-12 | 69.2 | 58.4 | 63.6 |
| Sep-12 | 68.7 | 58.3 | 63.3 |
| Dec-12 | 68.7 | 58.1 | 63.3 |
| Mar-13 | 68.9 | 58.1 | 63.3 |
| Jun-13 | 69.1 | 58.1 | 63.4 |
| Sep-13 | 69.9 | 58.8 | 64.1 |
| Dec-13 | 70.4 | 58.8 | 64.4 |
| Mar-14 | 70.6 | 59.3 | 64.8 |
| Jun-14 | 70.8 | 58.9 | 64.7 |
| Sep-14 | 70.6 | 59.6 | 64.9 |
| Dec-14 | 71.0 | 60.2 | 65.5 |
| Mar-15 | 71.2 | 60.2 | 65.6 |
| Jun-15 | 71.1 | 59.7 | 65.2 |
| Sep-15 | 70.1 | 59.1 | 64.5 |
| Dec-15 | 70.5 | 59.6 | 65.0 |
| Mar-16 | 70.7 | 60.2 | 65.3 |
| Jun-16 | 71.9 | 61.2 | 66.5 |
| Sep-16 | 72.4 | 61.1 | 66.6 |
| Dec-16 | 72.6 | 61.7 | 67.0 |
| Mar-17 | 73.2 | 61.8 | 67.4 |
| Jun-17 | 72.6 | 61.5 | 67.0 |
| Sep-17 | 73.5 | 62.4 | 67.8 |
| Dec-17 | 73.5 | 62.6 | 68.0 |
| Mar-18 | 73.3 | 62.8 | 68.0 |
| Jun-18 | 73.1 | 62.9 | 67.9 |
| Sep-18 | 73.2 | 63.4 | 68.2 |
| Dec-18 | 72.7 | 63.1 | 67.9 |
| Mar-19 | 72.5 | 62.9 | 67.6 |
| Jun-19 | 72.5 | 63.1 | 67.7 |
| Sep-19 | 72.6 | 63.0 | 67.7 |
| Dec-19 | 72.6 | 62.6 | 67.5 |
| Mar-20 | 72.8 | 62.8 | 67.7 |
| Jun-20 | 72.4 | 62.0 | 67.1 |
| Sep-20 | 71.8 | 61.2 | 66.4 |
The number of employed women fell 14,000 to 1,266,000, while the number of employed men fell 8,000 to 1,444,000. The employment rate for women was 61.2 percent and 71.8 percent for men.
COVID-19’s impact on women and work has more information on women’s participation in the labour market since COVID-19 took effect.
In Auckland, the unadjusted number of employed people fell by 18,000 over the September 2020 quarter, to reach 893,200. The number of people employed in the retail trade, accommodation, and food services industries in Auckland fell by 8,700 to 125,700, a fall of 6.5 percent.
“This quarter, Auckland spent seven weeks in higher COVID-19 alert levels than the rest of New Zealand, with the number of people in employment particularly affected, compared with the rest of the country,” Mr Broughton said.
The quarterly employment survey (QES) showed a fall in seasonally adjusted filled jobs of 8,700 (0.4 percent) over the quarter and a fall of 20,800 (1.0 percent) over the last six months, compared with a fall of 31,000 (1.1 percent) employed, as measured by the HLFS.
Underutilisation climbs
The seasonally adjusted underutilisation rate was 13.2 percent in the September 2020 quarter, up from 12.0 percent last quarter. Underutilisation had been generally trending down since its peak of 15.6 percent eight years ago. The current rate is the highest since the March 2016 quarter. There were 392,000 underutilised people in the September 2020 quarter, an increase of 38,000 since last quarter.
Underutilisation is made up of three components: unemployed people, underemployed people, and the potential labour force. This quarter’s rise in underutilisation largely reflects a sharp increase in unemployed people.
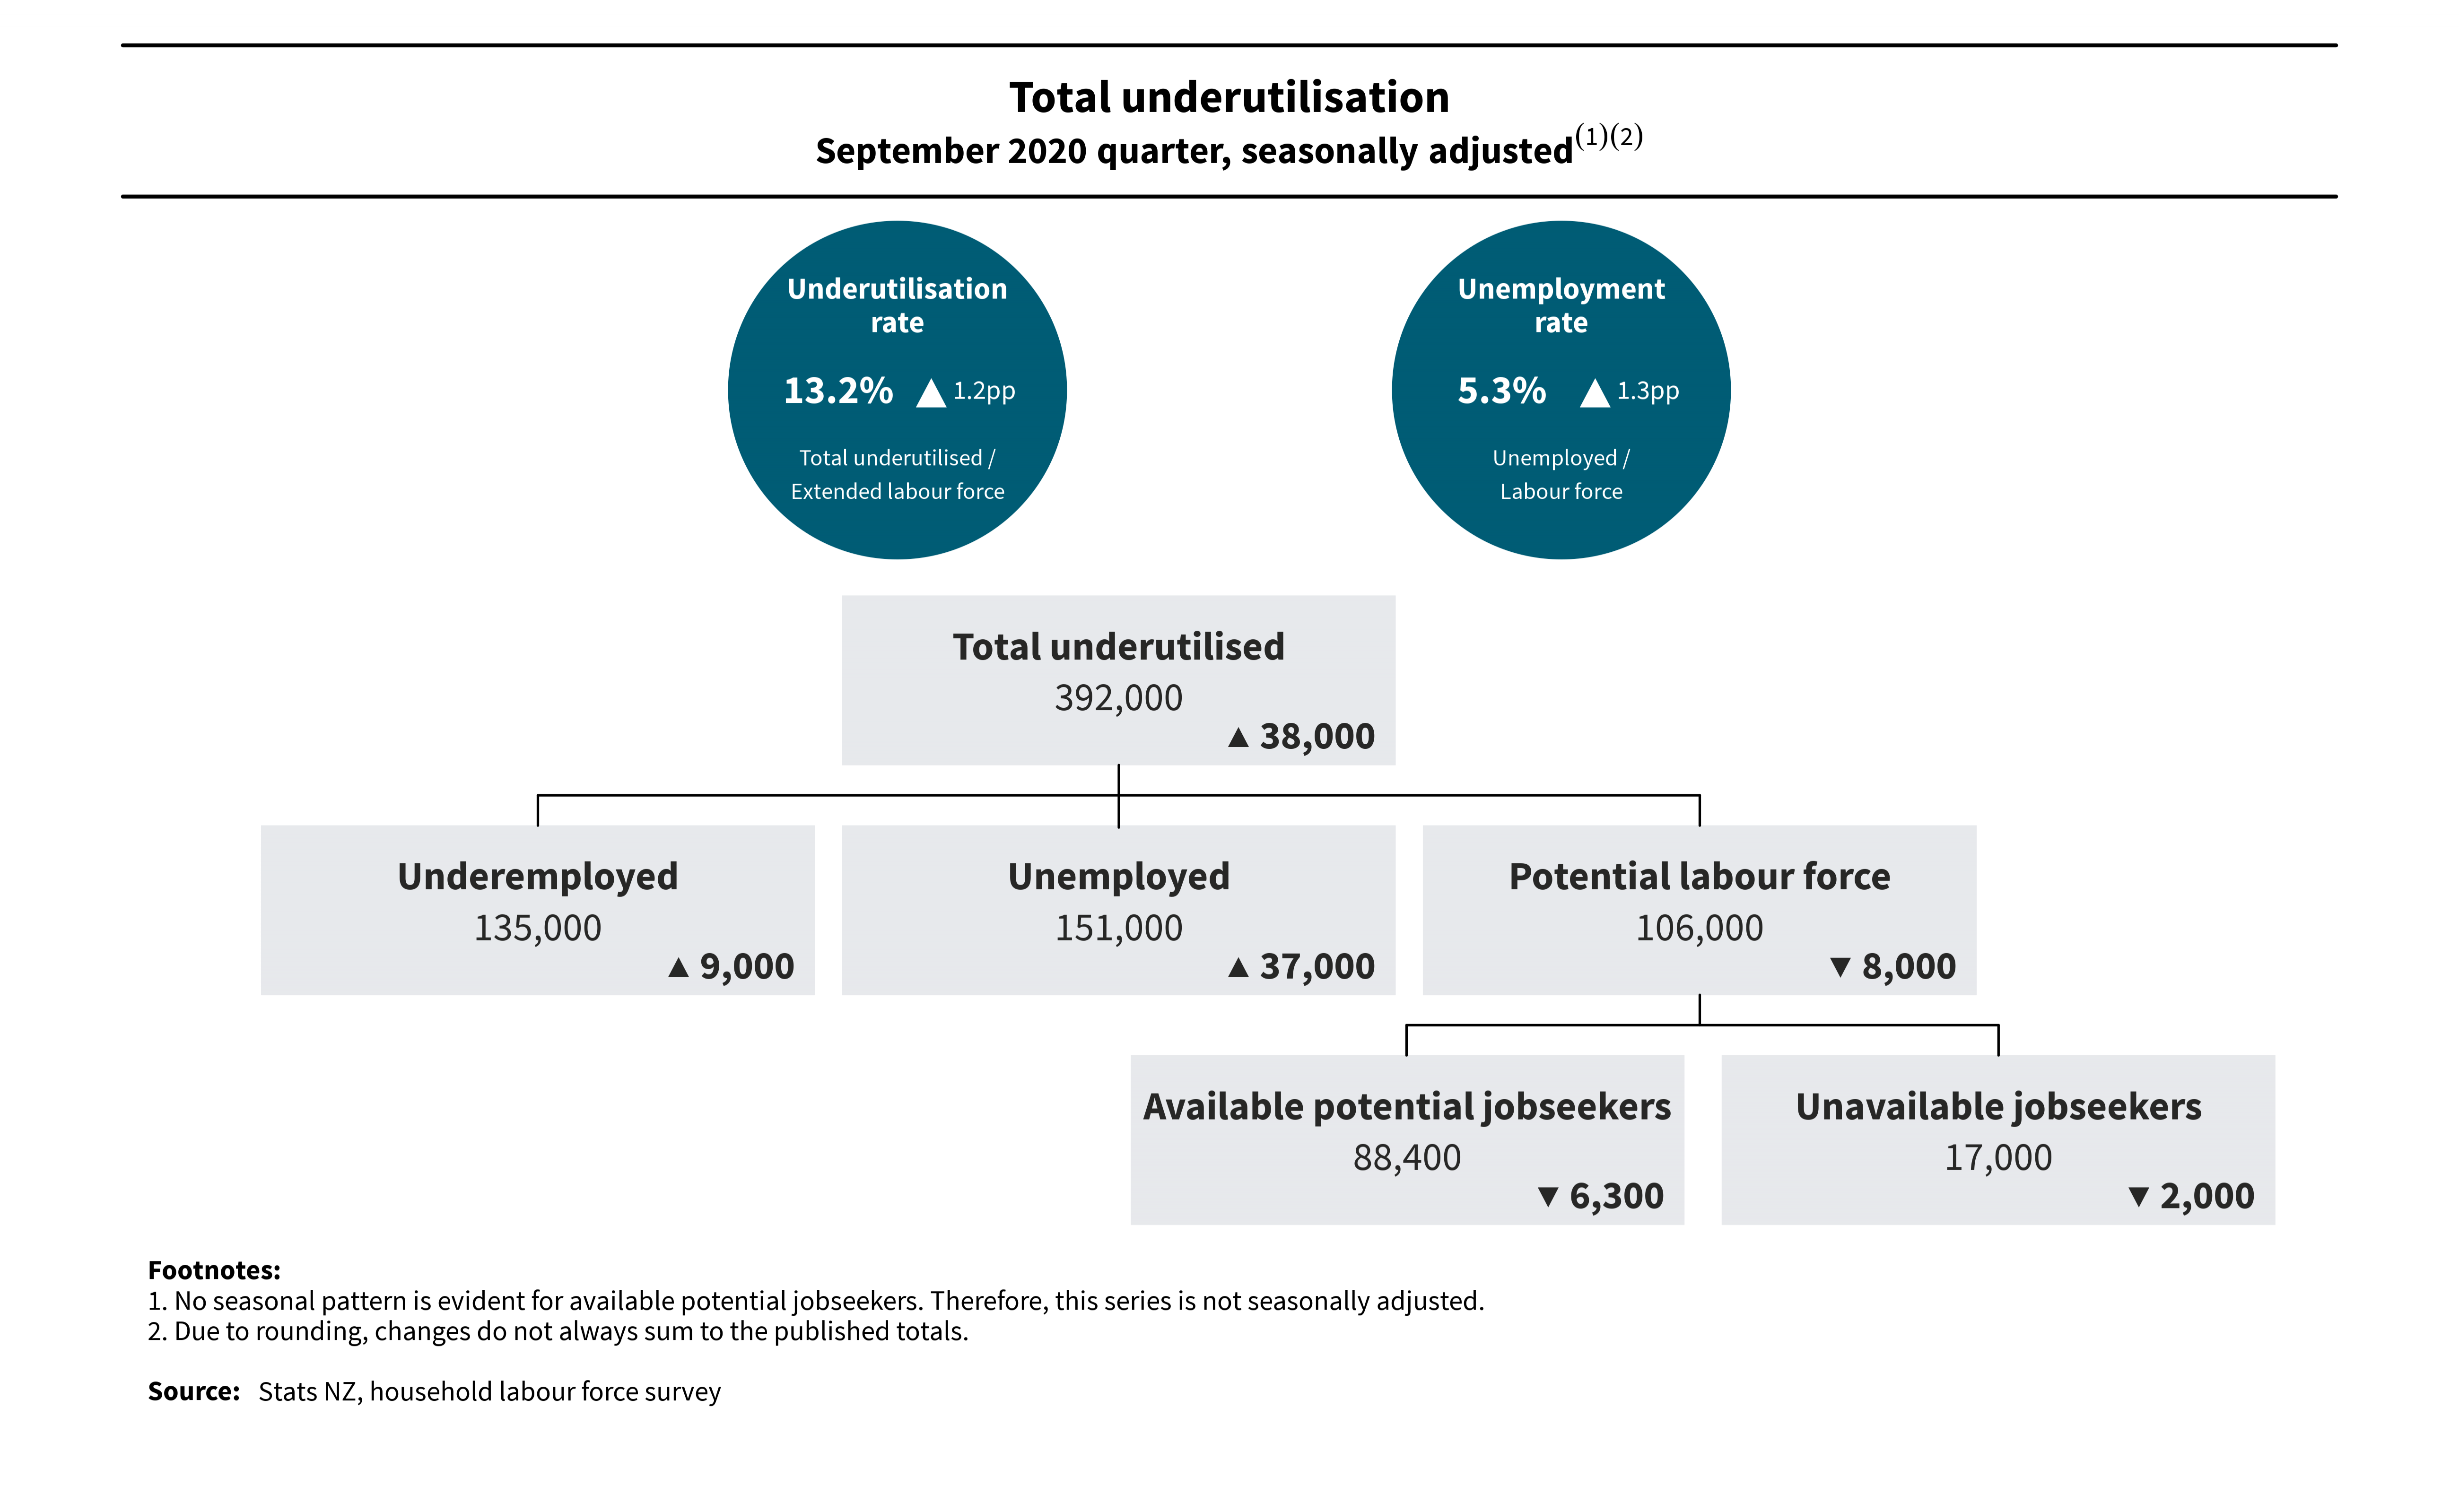
Text alternative for total underutilisation, September 2020 quarter, seasonally adjusted diagram
Hours nearly return to normal, pre-lockdown levels
In the September 2020 quarter, 91.4 million actual hours were worked, bouncing back to almost typical levels, despite the level 3 lockdown in Auckland. The recovery follows the record fall in the June 2020 quarter, when the number of actual hours fell by 9.5 million hours to 83.6 million. This was the biggest quarterly fall seen since the series began.
“Hours worked this quarter indicate a return to near normal. This quarter’s total hours are comparable to a year ago, when 92.4 million hours were worked in the September 2019 quarter,” said Mr Broughton.
In the September 2020 quarter, 12.6 percent of employed people were working less hours than usual in their main job, and 6.5 percent worked no hours at all (unadjusted). This was similar to pre-COVID-19 levels from a year ago, but well down from levels seen last quarter.
| Hours worked in main job compared to usual | Sep-19 |
| Worked more hours than usual | 8.7 |
| Worked the same number of hours as usual | 74.2 |
| “Worked less hours than usual | 11 |
| but more than zero” | 6.1 |
| “Employed | |
| but worked zero hours” |
| 8.2 | 9.1 |
|---|---|
| 73.5 | 74.9 |
| 10.5 | 11.5 |
| 5.7 | 6.5 |
| Hours worked in main job compared to usual | Jun-20 |
| Worked more hours than usual | 8.3 |
| Worked the same number of hours as usual | 57.8 |
| “Worked less hours than usual | 20.4 |
| but more than zero” | 13.5 |
| “Employed | |
| but worked zero hours” |
| 7.8 | 8.7 |
|---|---|
| 56.6 | 59.1 |
| 19.6 | 21.2 |
| 12.7 | 14.3 |
| Hours worked in main job compared to usual | Sep-20 |
| Worked more hours than usual | 9.1 |
| Worked the same number of hours as usual | 71.8 |
| “Worked less hours than usual | 12.6 |
| but more than zero” | 6.5 |
| “Employed | |
| but worked zero hours” |
| 8.6 | 9.6 |
|---|---|
| 70.9 | 72.7 |
| 12 | 13.2 |
| 6 | 6.9 |
In the September 2020 quarter, 56,700 people gave COVID-19-related reasons as the main reason they were working fewer hours than usual in their main job, down from 340,700 last quarter.
Aucklanders made up around two-thirds of people who gave COVID-19 as the main reason for their reduced hours this quarter, as they remained under stricter lockdown conditions than the rest of the country for much of the July-September 2020 period.
Wages grow
The labour cost index (LCI) salary and wage rates (including overtime) increased 1.9 percent in the year to the September 2020 quarter. Annually, public sector wage inflation was 2.6 percent, while private sector wage inflation was 1.6 percent.
Quarterly wage inflation was 0.6 percent, with public sector wages growing 0.9 percent. Occupations, such as police, hospital staff, and teachers experienced wage increases from previously agreed collective employment agreements, which influenced public sector wage inflation this quarter.
Private sector wages grew 0.4 percent in the September 2020 quarter, as occupations that faced voluntary pay decreases recovered to pre-COVID-19 levels.
The QES showed stronger wage growth, as average ordinary time hourly earnings increased to $33.81 (up 1.4 percent quarterly and 3.6 percent annually).
Text alternative for total underutilisation, September 2020 quarter, seasonally adjusted diagram
Diagram shows data from September 2020 quarter’s household labour force survey (HLFS).
The underutilisation rate was 13.2%, up 1.2pp (percentage points). This rate is derived from total underutilised divided by the extended labour force. The unemployment rate was 5.3%, up 1.3pp. This is derived from unemployed divided by labour force.
Total underutilised was up 38,000, to 392,000. Underemployed was up 9,000 to 135,000. Unemployed was up 37,000 to 151,000. The potential labour force was down 8,000 to 106,000.
Within the potential labour force, available potential jobseekers were down 6,300 to 88,400 and unavailable jobseekers were down 2,000 to 17,000.
Notes:
- No seasonal pattern is evident for available potential jobseekers. Therefore, this series is not seasonally adjusted.
- Due to rounding, changes do not always sum to the published totals.
Source: Stats NZ, household labour force survey


