This page provides an overview of the changes we will make to this year’s Stats NZ emissions accounts.
Contents
- Introduction to Stats NZ emissions accounts
- About global warming potentials
- Annual industry and household emissions
- Quarterly emissions
- Regional emissions
- Consumption-based emissions
- IPCC Sixth Assessment Report
- Further information
Introduction to Stats NZ emissions accounts
Stats NZ emissions accounts are compiled using the United Nations System of Environmental-Economic Accounting (SEEA) framework. This framework integrates economic and environmental data and follows a similar accounting structure to the System of National Accounts, used in the production of gross domestic product (GDP). This allows for direct comparison between Stats NZ emissions statistics and GDP. Stats NZ emissions statistics are underpinned by the Ministry for the Environment (MfE) New Zealand Greenhouse Gas Inventory. This ensures alignment and coherency between Stats NZ and MfE publications. Stats NZ emissions accounts include annual, quarterly, and regional production-based accounts, and a consumption-based account.
Every year, methodological improvements are made to the way SEEA air emissions are updated. The main change this year is to global warming potentials (GWPs), so this paper mainly focuses on this change. Additional methodological improvements to be incorporated soon include those for the agricultural sector in the Greenhouse Gas Inventory, improvements to manufacturing emissions measurement, and minor presentational changes. These are discussed in Other improvements.
About global warming potentials
There are many different greenhouse gases contributing to climate change, and each of these gases trap different amounts of heat in the Earth’s atmosphere. GWPs enable consistent reporting of different greenhouse gases. Emissions reporting and discussions on climate change tend to focus on carbon dioxide (CO2) because it is the dominant greenhouse gas produced by the burning of fossil fuels, industrial production, and land use changes. Therefore, the GWP for each gas is defined as its warming influence in relation to that of carbon dioxide over a particular period. Aotearoa New Zealand’s estimated emissions of each non-carbon-dioxide greenhouse gas (methane, nitrous oxide, fluorinated gases) are expressed in terms of their carbon dioxide equivalent (CO2-e), based on estimates of the different GWPs of each gas.
GWP estimates are updated by the Intergovernmental Panel on Climate Change (IPCC), based on new scientific knowledge of greenhouse gases, and communicated to the Parties to the Paris Agreement, which includes New Zealand, via assessment reports. From 2024, the Parties to the Paris Agreement will use GWP values provided in the IPCC Fifth Assessment Report (AR5) for international greenhouse gas reporting. Therefore, New Zealand needs to use GWPs from AR5 for international greenhouse gas reporting instead of those in the IPCC Fourth Assessment Report (AR4).
The GWPs used to compile New Zealand’s Greenhouse Gas Inventory (1990-2022), produced by the Ministry for the Environment, moved from version AR4 to AR5 in April 2024 under the Paris Agreement and the United Nations Framework Convention on Climate Change (UNFCCC). Both AR4 and AR5 apply the 100-year time horizon global warming potential (GWP100) values. To maintain alignment with the Inventory and other domestic and international reporting, Stats NZ will be adopting AR5 GWP100 values in upcoming emissions releases.
Gas | AR4 | AR5 |
Methane | 25 | 28 |
Nitrous oxide | 298 | 265 |
The changes to GWPs for fluorinated gases will have less impact as they are less significant in New Zealand’s emissions profile. GWPs are applied across the time series, so revisions will be made for all years.
New Zealand’s Greenhouse Gas Inventory (1990-2022) is the main data source for Stats NZ emissions series by industry and household, with additional data used to adjust for residency and allocate to industry ” href=”https://www.stats.govt.nz/methods/environmental-economic-accounts-sources-and-methods/”>Stats NZ Environmental-economic accounts: Sources and methods (third edition). We report on how the two sources align in the bridging tables of the annual greenhouse gas emissions (industry and household) release. To maintain consistency, the same GWP values will be adopted in all Stats NZ emissions accounts.
This change will flow through to the emissions accounts to be published as follows:
- Greenhouse gas emissions (industry and household): Year ended 2022 (30 May 2024)
- Greenhouse gas emissions (industry and household): March 2024 quarter (23 July 2024)
- Greenhouse gas emissions by region (industry and household): Year ended 2023 (22 August 2024)
- Greenhouse gas emissions (consumption-based): Year ended 2022 (provisional) (December 2024).
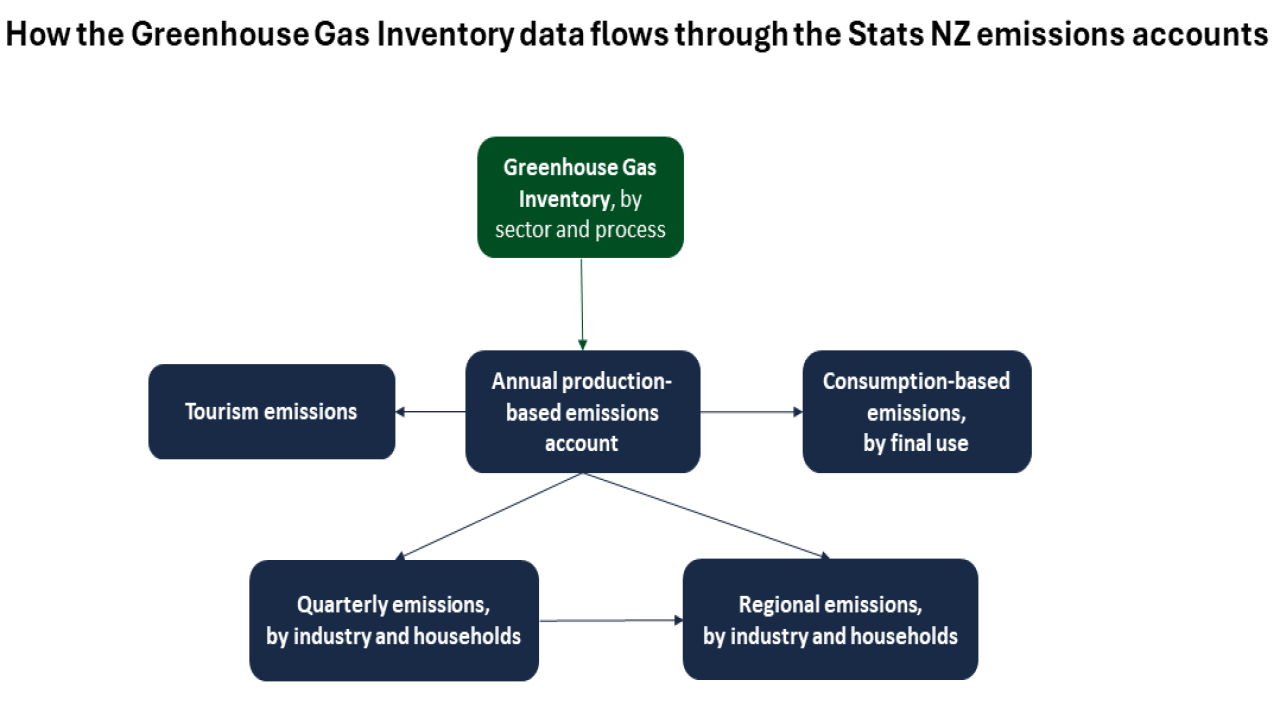
Figure 1 shows how information from the Greenhouse Gas Inventory flows through the different emissions accounts produced by Stats NZ.
Figure 1
The figures in this paper give broad indicators of the expected effect of updates and improvements when compared with last year’s annual release published in May 2023. The numerical values are indicative and may change in the final publications.
Annual industry and household emissions
Impact of moving to AR5 GWPs on Stats NZ annual industry and household emissions accounts
GWPs are applied as constant scalars, meaning that changes in GWPs mainly result in level shifts rather than changes to movements. Revisions to annual percentage movements can occur depending on the significance and movements of different gases, however, these are expected to be minor.
Overall impact
On average, SEEA based industry and household emissions are expected to increase by around 3,145 kilotonnes, 3.9 percent, across the time series (based on analysis for 2007 to 2021). Annual percentage changes, that is the relative movement between years, are largely unaffected. Figure 2 shows the illustrative impact of moving to AR5 GWPs for total industry and household estimates.
Figure 2
| Year | AR4 | AR5 (provisional) |
| 2007 | 82487 | 85841 |
| 2008 | 82115 | 85289 |
| 2009 | 78924 | 82118 |
| 2010 | 79461 | 82671 |
| 2011 | 79175 | 82380 |
| 2012 | 81223 | 84440 |
| 2013 | 80526 | 83736 |
| 2014 | 81323 | 84537 |
| 2015 | 81294 | 84448 |
| 2016 | 79372 | 82458 |
| 2017 | 81001 | 84066 |
| 2018 | 81502 | 84554 |
| 2019 | 82734 | 85779 |
| 2020 | 78514 | 81529 |
| 2021 | 77638 | 80626 |
Impacted industries
New Zealand’s methane and nitrous oxide emissions mainly come from agriculture and the electricity, gas, water, and waste services industries. The impacts of moving to the updated GWPs in AR5 will mainly be observable for the agriculture industry (expected to increase by 7.1 percent on average), and electricity, gas, waste, and water services industries (expected to increase by 3.1 percent on average).
Moderate revisions will be observable for mining (up 3.7 percent on average), but this is a lower absolute change than for electricity, gas, waste, and water services.
Minor revisions will be made to all industries and households given small amounts of methane and nitrous oxide are produced in transportation.
Industries mainly dominated by carbon dioxide will be largely unchanged, such as services, transport, and tourism. These industries will still have minor revisions since fluorinated gases, methane, and small amounts of nitrous oxide are allocated around the economy.
Households will be subject to some revision because of methane emissions (mainly from waste) and nitrous oxide emissions from transport.
Comparison to Greenhouse Gas Inventory impacts
New Zealand’s Greenhouse Gas Inventory (1990-2022) shows that moving to AR5 GWPs increased the gross national emissions total by 4.4 percent on average across the time series. This change had the largest relative impact on the emission totals for the agriculture and waste sectors. The increase in the gross Inventory total is larger than the anticipated impact on Stats NZ SEEA industry and household estimates (average 3.9 percent). This is likely due to the difference in scope. SEEA estimates include more carbon dioxide than the Greenhouse Gas Inventory as it covers emissions from resident activity abroad (particularly international aviation). It does this to maintain consistency with the System of National Accounts, used to measure gross domestic product (GDP). This means the impact on total emissions of changing the GWPs for other gases is less in the SEEA than in the Inventory.
The impact on the agriculture sector, reported in the Inventory, compared to the agriculture industry, reported in Stats NZ emissions accounts, will also be different. Agriculture sector emissions refer to those from agricultural processes (for example, enteric fermentation, manure management), while agriculture industry emissions are those directly attributable to economic units defined as agriculture, which can cover process emissions from any sector. Almost all agriculture sector emissions are allocated to the agriculture industry (small amounts are allocated to forestry and arts and recreation services). However, a significant amount of methane from the waste sector (781 kilotonnes CO2-e in 2021 using AR4 GWPs) is allocated to the agriculture industry, which will add to the impact on industry estimates. Therefore, the agriculture industry impact will be greater than the sector impact.
Conversely, the impact on the waste sector will be greater than that of the waste industry as waste sector emissions are allocated to the waste industry as well as agriculture, manufacturing, health care, and households.
Approaches to measuring New Zealand’s greenhouse gas emissions has more information on the differences between the Inventory and SEEA estimates.
Other improvements
Agriculture
There were additional methodological improvements to the Greenhouse Gas Inventory in April 2024 for the agriculture sector, which increased agricultural emissions further. These will be incorporated into Greenhouse gas emissions (industry and household): Year ended 2022 released on 30 May 2024.
Analysis here does not include the methodological changes to the agricultural sector in the Greenhouse Gas Inventory. These include improved estimates of within-year beef cattle population and live weights, updated proportion of lambs held over to a second slaughter date, and revisions to agricultural statistics from the latest available activity data. For further information, see New Zealand’s Greenhouse Gas Inventory (1990-2022), page 396.
Manufacturing
An adjustment has been made in the allocation of stationary energy emissions in manufacturing. Analysis showing the alignment between annual manufacturing industry estimates and quarterly indicators highlighted a discrepancy in the fuel type allocation. The effect was a redistribution across some manufacturing industries, particularly food, beverage, and tobacco product manufacturing and other manufacturing. This adjustment will lead to a quality improvement in Stats NZ quarterly emissions accounts, and minor revisions to the time series.
Emissions intensity
This industry and household release will include a change to the calculation of emissions intensity for the economy. This change will mean the emissions intensity calculation is the same as the quarterly emissions series, so both are in line with United Nations Economic Commission for Europe recommendations for climate change indicators.
The change to AR5 does not affect the presentation of emissions intensity as these are expressed as indexes. Users re-expressing emissions intensity as levels will observe a shift in emissions intensity levels.
Tourism
A framework for Measuring Sustainable Tourism was endorsed by the United Nations Statistical Commission at its 55th session (27 February to 1 March 2024). Stats NZ tourism emissions estimates are compiled under this framework and have been termed provisional while the framework is under development. We are yet to assess whether additional work is required to bring the tourism emissions estimates into line with the recently endorsed version.
Quarterly emissions
As the quarterly series is benchmarked to the annual industry and household estimates, the actual (that is, seasonally unadjusted) quarterly series will be subject to the same changes in levels.
We expect revisions to the movements in the quarterly industry and household series from the change to AR5 GWPs as the seasonal patterns for agriculture significantly influence the total seasonal patterns, and seasonal adjustment process.
Regional emissions
Agriculture is the main contributor to all regions production-based emissions other than Auckland and Nelson. Revisions are likely to be most significant where agricultural activity is more intense: Canterbury, Waikato, Southland, Manawatū-Whanganui, and Otago in particular. Revisions to electricity, gas, water, and waste services will mainly affect Waikato, and mining emissions revisions will mainly impact Taranaki.
We are planning to include regional household emissions per capita in table 1 of Greenhouse gas emissions (industry and households) by region: Year ended 2023 alongside regional industry emissions intensity and total regional emissions per capita.
Consumption-based emissions
Consumption-based emissions estimates are expected to increase with AR5 GWPs, but to a lesser extent than the production-based emissions account, likely by 2 to 3 percent rather than near 4 percent. This is because most of New Zealand’s methane emissions are embodied in exports, and New Zealand is a net exporter of methane.
For household consumption-based emissions, the greatest impact will be observable in the food and non-alcoholic beverages category.
IPCC Sixth Assessment Report
There has been interest in improved accounting for the warming impact of short-lived gases such as methane. The IPCC’s Sixth Assessment Report (AR6) identifies the Combined Global Temperature Change Potential and GWP* metrics, which recognise that a sustained increase or decrease in the rate of short-lived greenhouse gas emissions has a similar effect on global surface temperature as one-off emission or removal of carbon dioxide.
Further international research is required to understand how these approaches may be used in the SEEA framework, which is used to produce Stats NZ emissions accounts.
Further information
Approaches to measuring New Zealand’s greenhouse gas emissions provides an overview of emissions statistics in New Zealand and how they relate to each other.
AR5 Synthesis Report: Climate Change 2014 provides an overview of the state of knowledge on the science of climate change, emphasising new results since the publication of the IPCC Fourth Assessment Report (AR4) in 2007.
Consumption-based greenhouse gas emissions (industry and household): Sources and methods – DataInfo+ presents the data sources and methods used for producing this account.
Environmental-economic accounts: Sources and methods (third edition) presents the data sources and methods used for Stats NZ environmental-economic accounts, including Greenhouse gas emissions (industry and household): Year ended 2021.
Quarterly greenhouse gas emissions (industry and household): Sources and methods presents the data sources and methods used for producing all the quarterly emissions accounts, including Greenhouse gas emissions (industry and household): December 2023 quarter.
Regional greenhouse gas emissions (industry and household): Sources and methods – DataInfo+ presents the data sources and methods used for producing all the quarterly emissions accounts, including Greenhouse gas emissions by region (industry and household): Year ended 2022.
Text alternative
Text alternative for figure 1, How the Greenhouse Gas Inventory data flows through the Stats NZ emission accounts.
Flow chart showing how emissions from the Greenhouse Gas Inventory from the Ministry for the Environment (top of chart) flow through the Stats NZ system of environmental-economic accounting (SEEA) industry and household emissions accounts starting with the annual production-based emissions accounts (middle of the chart). From this account, updated data from the Greenhouse Gas Inventory is incorporated into all other Stats NZ emissions accounts including quarterly emissions (bottom left), regional emissions (bottom right), consumption-based emissions (right), and tourism emissions (left).
ISBN 978-1-99-104994-0
Enquiries
Adam Tipper
04 931 4944
[email protected]


