Often Pacific peoples live in large households, which can have benefits for language transmission and loneliness, but due to the affordability and availability of suitable housing, in 2018 nearly 40 percent lived in a home that required additional bedrooms for the number of people living in it, Stats NZ said today.
In the 2018 Census, almost 400,000 people living in New Zealand identified with at least one Pacific ethnicity; two-thirds were born in Aotearoa and around 60 percent were under 30 years old.
“Our growing Pacific population is often unsupported by our current housing, particularly in large urban areas like Auckland where Pacific peoples are most likely to be located – and where even unsuitable housing can be unaffordable to rent or own,” wellbeing and housing statistics manager Sarah Drake said.
Index of territorial authorities and Auckland local board areas is available from Pacific housing report.
Pacific peoples population by SA2, 2018 is an interactive map showing the distribution of Pacific peoples throughout New Zealand by the 2018 statistical area 2.
Pacific peoples are more likely than the total population to rely on the rental market for their housing.
In the 2018 Census:
- 65 percent of Pacific peoples lived in rented homes, compared with 36 percent of the total population
- 35 percent of Pacific peoples lived in owner-occupied homes, compared with 64 percent of the total population.
“Pacific peoples often live in larger family groups where intergenerational living can support language transmission. In 2018, children were more likely to speak a Pacific language if they lived with family members who also spoke it,” Drake said.
In the 2018 Census, 57 percent of households with Pacific peoples had five or more usual residents.
| Number | Bedrooms | Usual residents |
| 1 | 2.9 | 2.4 |
| 2 | 11.1 | 8.4 |
| 3 | 46 | 13.2 |
| 4 | 26.3 | 18.6 |
| 5 | 10 | 17.6 |
| 6 | 2.7 | 14.4 |
| 7 | 0.8 | 9.7 |
| 8+ | 0.3 | 15.7 |
2018 General Social Survey data showed that living with more people was associated with lower rates of loneliness for Pacific peoples:
- Of Pacific peoples living in a household with six or more people, 76 percent never felt lonely, compared with 46 percent who lived in one-person households.
- For all Pacific peoples, the average family wellbeing score in 2021 was 8.1 out of 10, compared with 7.7 out of 10 for the total population.
In Aotearoa, the types of homes needed to support large households are often expensive or unavailable.
2018 Census data showed just 4 percent of rented homes had five or more bedrooms, while 39 percent of Pacific peoples lived in a home that required additional bedrooms for the number of people living there. By comparison only 11 percent of the total population lived in a crowded dwelling.
“Despite the benefits of living in larger family groups, homes that are too small for the number of occupants can be linked to a range of negative housing outcomes, which can in turn affect health and wellbeing,” Drake said.
2018 General Social Survey data reflected the well-known connection between household crowding and poorer housing conditions.
Of people living in homes that required additional bedrooms, 54 percent had a problem with damp, cold, mould, or needed major repairs, compared with 30 percent of those living in un-crowded homes.
Housing condition is important for both health and wellbeing.
In 2018, of Pacific peoples living in homes with at least one major housing problem (cold, mould, damp, or a need for repairs):
- 22 percent gave a low rating for physical health, compared with 12 percent for people without any housing problems (a rating of fair or poor on a scale of poor, fair, good, very good, or excellent)
- 29 percent had poor overall mental wellbeing, compared with 13 percent of people without housing problems (measured using the WHO-5 Wellbeing Index, a score of 51 or less out of 100 indicates poor mental wellbeing)
- 31 percent gave a low rating for their overall life satisfaction compared with 12 percent of people without housing problems (a rating between 0 and 6 on a 0 to 10 scale where 0 is completely dissatisfied with life and 10 is completely satisfied).
A lack of suitable affordable housing places a burden on the Pacific population, with one of the worst consequences being severe housing deprivation. Pacific peoples experience severe housing deprivation at a greater rate than the total population.
In 2018, the homelessness prevalence rate for Pacific peoples was 578 people per 10,000 compared with 217 people per 10,000 people for the total population.
Severe housing deprivation includes those without shelter (for example, rough sleepers), in temporary accommodation (for example, emergency housing or a camping ground), sharing accommodation (temporary residents in severely crowded dwellings), and uninhabitable housing.
For more information see:
- Severe Housing Deprivation in Aotearoa New Zealand, 2018 (PDF)
- New Zealand Definition of homelessness: 2015 update
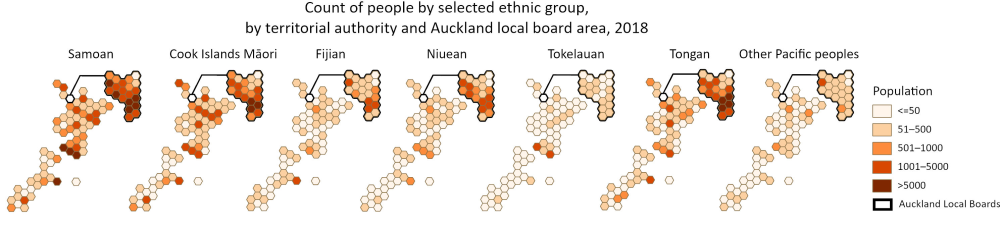
Text alternative for Count of people by selected ethnic group, by territorial authority area and Auckland local board area, 2018
The image shows seven hexagonal cartograms, each for a selected ethnic group. The cartograms show the territorial authorities of New Zealand, each represented by a hexagon in the approximate geographic location of that territorial authority. For the Auckland region, a pop-out group of hexagons represent the local board areas of that region.
Each hexagon is assigned a colour. The colours represent the count of people in that area for each selected ethnic group. The colours are grouped into counts of 50 people or less, 51 to 500 people, 501 to 1,000 people, 1,001 to 5,000 people, and more than 5,000 people. The first six maps represent selected ethnic groups: Samoan, Cook Islands Māori, Fijian, Niuean, Tokelauan, and Tongan. The final map represents Other Pacific peoples.
Ethnic group (detailed total response – level 3) and languages spoken by sex, for the census usually resident population count, 2006, 2013, and 2018 Censuses (RC, TA, SA2, DHB) in NZ.Stat has more detailed data.


