What is measured
This indicator measures long-term soil erosion levels across Aotearoa New Zealand using the New Zealand Empirical Erosion Model (NZEEM, see About the data for more details) and is based on two different datasets:
- NZEEM using the ‘Woody layer’
- NZEEM using the Land Cover Database (LCDB).
The ‘Woody layer’ and LCDB are land cover datasets that describe the vegetation cover across New Zealand. This indicator uses the ‘Woody layer’ for the first time because it provides higher resolution vegetation cover and is updated annually.
We report the estimated long-term soil erosion levels across New Zealand in 2022 from NZEEM using the ‘Woody layer’.
We report on hot and cold spots, showing statistically significant clusters of locations with high or low erosion rates relative to the national average for the seven-year period from 2016 to 2022 from NZEEM using the ‘Woody layer’.
We also report the average rate of soil erosion by region in 1996, 2001, 2008, 2012, and 2018 from NZEEM using each of the years LCDB is available (the latest year being 2018).
Why it is important
Soil erosion leads to a loss of topsoil that is valuable for productive purposes and affects soil ecosystem health. It also leads to fine sediment in rivers, streams, lakes, and the coastal environment, causing problems for water and coastal ecosystems, such as the modification or loss of seagrass meadows that provide nurseries for snapper and other fin fisheries (Morrison et al., 2009).
New Zealand has very high levels of soil erosion by world standards, due to its steep terrain, high rainfall, and tectonic activity (Basher, 2013; Hicks et al., 2011; Soons & Selby, 1992). While soil erosion is a natural process, it can be accelerated due to climatic conditions or when human activities modify soil, or vegetation, including from farming, construction, and mining (Wantzen & Mol, 2013). Generally, soil erosion in the South Island is more likely due to high rainfall and vulnerable, steep, mountainous terrain, while in the North Island it is due to the historical clearance of forest on steep slopes for pastoral agriculture (Koons, 1990; Page et al., 2000).
Key findings
NZEEM using the ‘Woody layer’
In 2022:
- An estimated 182 million tonnes of eroded soil entered New Zealand’s rivers.
- Of all regions, the West Coast (48 million tonnes) and Gisborne (36 million tonnes) had the highest levels of sediment movement into waterways.
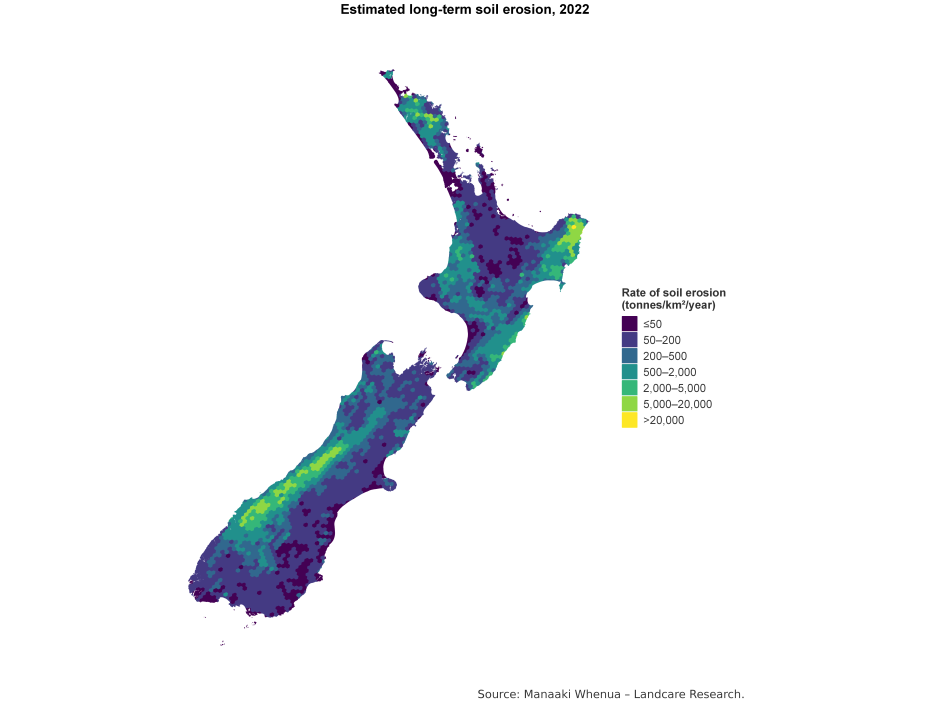
Text alternative for Estimated long-term soil erosion, 2022
A map of New Zealand represents a snapshot of the estimated long-term soil erosion (million tonnes per km2 per year) around New Zealand in 2022. The map shows hexagonal grid cells coloured one of seven colours, according to the range in the rate of soil erosion, from less than or equal to 0.01 million tonnes per km2 per year to greater than 1.50 million tonnes per km2 per year.
Between 2016 and 2022:
- Hot spots were identified in Northland, the east coast of the North Island, Taranaki, Waikato, and the west coast of the South Island, representing statistically significant clusters of locations with high rates of soil erosion relative to the national average.
- Cold spots were identified in the Nelson and Marlborough regions, and the central North Island, representing statistically significant clusters of locations with low rates of soil erosion relative to national average.
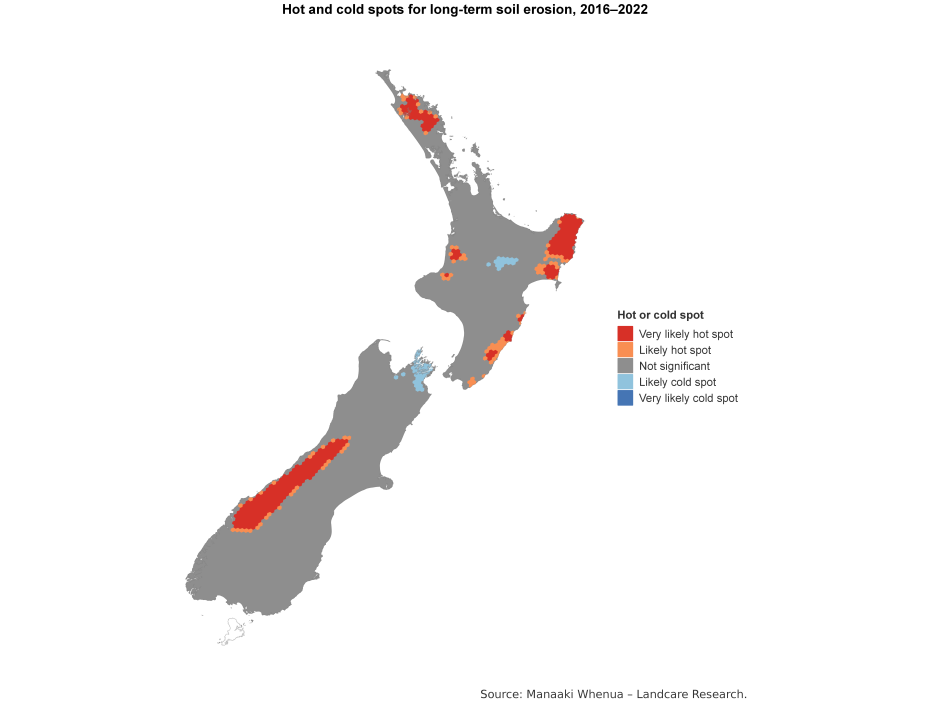
Text alternative for Hot and cold spots for long-term soil erosion, 2016-2022
A map of New Zealand shows hexagonal grid cells that are either hot spots or cold spots for estimated long-term soil erosion from 2016 to 2022. Each cell in the map is one of five colours: red represents a very likely hot spot with 90 percent confidence; light red represents a likely hot spot with 66 percent confidence; grey represents no significant hot spot or cold spot; light blue represents a likely cold spot with 66 percent confidence; dark blue represents a very likely cold spot with 90 percent confidence.
NZEEM using the LCDB
From 1996 to 2018:
- The Gisborne region had the highest average rate of soil erosion at every interval. However, the erosion rate decreased from 5,800 tonnes per square kilometre per year in 1996 to approximately 4,400 tonnes in 2018.
- The Nelson region had the lowest average rate of soil erosion which was relatively stable over time.
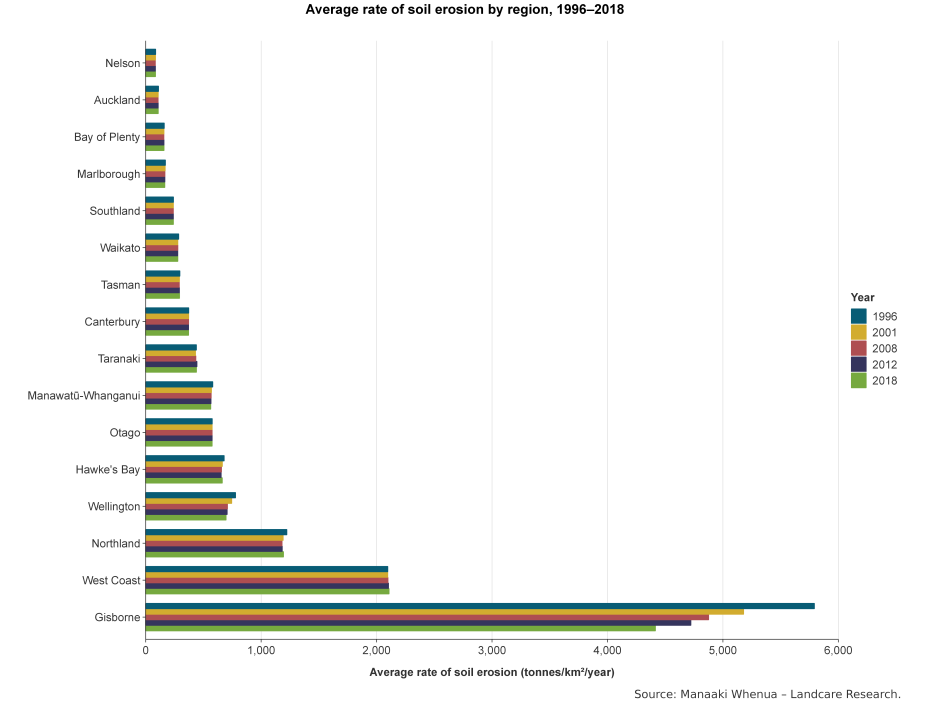
Text alternative for Average rate of soil erosion by region, 1996-2018
A bar graph shows the average rate of soil erosion (tonnes per km2 per year) around New Zealand by region, for 1996, 2001, 2008, 2012, and 2018. Each region bar in the graph is one of five colours, representing the five different years. The bars of the graph show regions with the lowest average erosion rate at the top, through to the highest average amount at the bottom. The data is available from Average rate of soil erosion by region, 1996-2018 (CSV, 4KB).
Where this data comes from
Manaaki Whenua – Landcare Research
View data table
Estimated long-term soil erosion: Data to 2022
Related indicators
Coastal and estuarine water quality
Highly erodible land: Data to 2022
Related content
NZEEM (erosion rates) North Island
NZEEM (erosion rates) South Island
Technical report
About the data
NZEEM and aggregation
Manaaki Whenua – Landcare Research provided data estimating long-term soil erosion. Estimated long-term soil erosion is the average mass of soil lost per square kilometre per year (tonnes/km2/year). It is estimated by NZEEM, the New Zealand Empirical Erosion Model, based on mean annual rainfall, terrain type, and land cover (Dymond et al., 2010).
Estimated long-term soil erosion 2024 – Datainfo+ provides further information about NZEEM.
We aggregated raw mean sediment yield values (tonnes/km²/year) into hexagonal polygons, the majority of which have an area of approximately 96km². In particular, an OGC (Open Geospatial Consortium) standard compliant ISEA (Icosahedral Snyder Equal Area) grid was implemented.
The total annual sediment in waterways (tonnes/year) for a particular region is the sum of all soil erosion over the entire region in a year (Dymond et al., 2010). Average soil erosion rate for a region is calculated by dividing the total annual sediment yield of that region by its corresponding area (km2). We defined regions using 2023 regional council boundaries.
Land cover information
Land cover data describes the types and extent of vegetation and built or natural features that cover the land’s surface. The land cover factor in NZEEM comes from either the ‘Woody layer’ or the New Zealand Land Cover Database (LCDB). The ‘Woody layer’ has seven versions produced from Sentinel-2 satellite imagery, covering seven consecutive years from 2016 to 2022. LCDB provides five versions of land cover information across the country derived from SPOT and Landsat 7 ETM+ satellite imagery, for the following dates: 1996, 2001, 2008, 2012, and 2018.
The ‘Woody layer’ is used for producing the estimated long-term soil erosion map for New Zealand in 2022 and hot spot analysis from 2016 to 2022; LCDB is used for generating average soil erosion rate data for each region in 1996, 2001, 2008, 2012 and 2018, providing five ‘snapshots’ over a 22-year period.
Estimated long-term soil erosion 2024 – Datainfo+ provides further information about hot spot analysis.
Limitations
Land cover is mapped by the ‘Woody layer’ and LCDB, however, it does not include what the land is used for or how it is used. We do not have the data available to accurately estimate the national extent of accelerated erosion from land uses. This means that this measure cannot track the impact of land management (such as stocking rate or riparian planting).
The resolution of the ‘Woody layer’ land cover map is 10m by 10m, while LCDB has a resolution of 100m by 100m. For LCDB, this means that the impact of some soil conservation actions is not included, as individual trees (such as space-planted poplars used commonly in soil conservation) may be missed. Progress has been made in the ‘Woody layer’ to create vegetation maps that show a finer level of land cover detail (Dymond & Shepherd, 2023).
Estimated long-term soil erosion 2024 – Datainfo+ provides further information about the use of high-resolution spatial layers for soil erosion and conservation mapping.
NZEEM is an empirical model suitable for predicting long-term soil erosion at the national or regional scale. However, it does not model the impact of recent localised storm events, which can significantly affect erosion rates at specific locations.
The rainfall factor in NZEEM is derived from the LENZ (Land Environments of New Zealand) layer, representing the average annual rainfall in a 30-year period. Consequently, this indicator does not reflect recent climatic changes.
Data quality
The accuracy of the data source is of high quality.
Estimated long-term soil erosion is a direct measure of the ‘Land and soil condition’ topic.
Stats NZ and the Ministry for the Environment must report on topics related to the five environmental domains: air, atmosphere and climate, fresh water, land, and marine. These topics identify key issues within each domain.
Topics for environmental reporting describes the topics for each domain.
Data quality information has more information about the criteria we use to assess data quality.
References
Basher, L. (2013). Erosion processes and their control in New Zealand. In J. R. Dymond (Ed.), Ecosystem services in New Zealand – conditions and trends (pp. 363-374). Manaaki Whenua Press. https://doi.org/10.7931/DL1MS3
Dymond, J., & Shepherd, J. (2023). Update to Highly Erodible Land and Estimated Long-term Soil Erosion data sets for Environmental Reporting (Contract Report: LC4365). Manaaki Whenua – Landcare Research. https://environment.govt.nz/publications/update-to-highly-erodible-land-and-estimated-long-term-soil-erosion-data-sets-for-environmental-reporting
Dymond, J. R., Betts, H. D., & Schierlitz, C. S. (2010). An erosion model for evaluating regional land-use scenarios. Environmental Modelling & Software, 25(3), 289-298. https://doi.org/10.1016/j.envsoft.2009.09.011
Hicks, D. M., Shankar, U., McKerchar, A. I., Basher, L., Lynn, I. H., Page, M., & Jessen, M. (2011). Suspended Sediment Yields from New Zealand Rivers. Journal of Hydrology. New Zealand, 50(1), 81-142. https://www.hydrologynz.org.nz/journal/volume-50-2011
Koons, P. O. (1990). Two-sided orogen: Collision and erosion from the sandbox to the Southern Alps, New Zealand. Geology, 18(8), 679-682. https://doi.org/10.1130/0091-7613(1990)0182.3.CO;2
Morrison, M., Lowe, M., Parsons, D., Usmar, N., & McLeod, I. (2009). A review of land-based effects on coastal fisheries and supporting biodiversity in New Zealand (New Zealand Aquatic Environment and Biodiversity Report No. 37, 2009). Ministry of Fisheries. https://fs.fish.govt.nz/Doc/22003/AEBR_37.pdf.ashx
Page, M., Trustrum, N., & Gomez, B. (2000). Implications of a century of anthropogenic erosion for future land use in the Gisborne‐East Coast Region of New Zealand. New Zealand Geographer, 56(2), 13-24. https://doi.org/10.1111/j.1745-7939.2000.tb01571.x
Soons, J., & Selby, M. (Eds.). (1992). Landforms of New Zealand (2nd ed.). Longman Paul.
Wantzen, K. M., & Mol, J. H. (2013). Soil erosion from agriculture and mining: a threat to tropical stream ecosystems. Agriculture, 3(4), 660-683. https://doi.org/10.3390/agriculture3040660
Archived pages
Archived March 2024:
Estimated long-term soil erosion – published April 2018


