The number of women working in key tourism industries dropped more than 8 percent in the June 2020 quarter compared with the same time last year, Stats NZ said today.
For key tourism industries in the June 2020 quarter compared with the June 2019 quarter:
- the number of women employed was down 8.4 percent (11,300)
- the number of Māori women employed was down 20.5 percent (4,000)
- total hours worked was down 32.7 percent
- average weekly earnings were down 8.2 percent or $76 less per week.
“Key tourism industries include accommodation, passenger transport, travel agencies, sightseeing operators, and cafes and restaurants. These industries were hit hard by the COVID-19 lockdown in April, following the border closure to international tourists in late March,” labour market statistics manager Andrew Neal said.
The impacts on these industries were a large drop in the number of women employed, overall fewer hours worked, and lower earnings, compared with the same time last year.
These indicative figures come from household labour force survey data and tourism satellite account industry classifications. A key tourism or ‘characteristic’ industry is where at least one-quarter of the goods or services it produces is consumed by international or domestic tourists.
| Industry | Female |
| Key tourism industries | -8.4 |
| Non-tourism industries | 1.3 |
| All industries | 0.3 |
| -15.8 | -1 |
|---|---|
| -0.1 | 2.8 |
| -1 | 1.6 |
| Industry | Male |
| Key tourism industries | 1.2 |
| Non-tourism industries | 2 |
| All industries | 2 |
| -8.4 | 10.8 |
|---|---|
| 0.6 | 3.5 |
| 0.8 | 3.1 |
Across all industries, the total number of employed people rose as the population increased. However, the number of women working in tourism industries fell 8.4 percent – 11,300 fewer women in the June 2020 quarter compared with a year ago. This is the largest decrease for women in tourism industries since 2009 (when Stats NZ introduced new employment industry classifications).
Drop in Māori women in tourism industries
There were 4,000 fewer Māori women employed in tourism industries in the June 2020 quarter than a year ago (a 20.5 percent drop). In the June 2019 quarter, 19,500 Māori women were employed in tourism industries, but by the June 2020 quarter the number dropped to 15,500. Overall, Māori workers in tourism industries decreased 16.9 percent.
| Ethnic group | Jun-19 |
| European | 88600 |
| Māori | 19500 |
| Asian | 27000 |
| Pacific peoples | 8000 |
| 81500 | 95700 |
|---|---|
| 16200 | 22800 |
| 22700 | 31300 |
| 5800 | 10200 |
| Ethnic group | Jun-20 |
| European | 82100 |
| Māori | 15500 |
| Asian | 25400 |
| Pacific peoples | 8800 |
| 75200 | 89000 |
|---|---|
| 12400 | 18600 |
| 21400 | 29300 |
| 6600 | 11000 |
The number of European and Asian women employed in tourism industries decreased about 6 percent, but this was not significantly different to the same period last year.
Hours worked and earnings fall nationally
The number of hours worked in tourism industries fell almost one-third in the June 2020 quarter compared with the same quarter last year, as the COVID-19 lockdown saw non-essential businesses closed for part of the quarter.
| Quarter | Key tourism industries | Non-tourism industries |
| Mar-10 | 6.2 | -1.7 |
| Jun-10 | -2.9 | 1.6 |
| Sep-10 | -1.5 | 3.2 |
| Dec-10 | -0.4 | 4 |
| Mar-11 | -7.2 | -0.2 |
| Jun-11 | 7 | 1.1 |
| Sep-11 | 3.1 | 1.2 |
| Dec-11 | 6.5 | 0.2 |
| Mar-12 | 6.3 | -0.2 |
| Jun-12 | 1.6 | -0.6 |
| Sep-12 | 4.3 | -2 |
| Dec-12 | 3.8 | -4.5 |
| Mar-13 | 9.4 | 5.4 |
| Jun-13 | 3.8 | 2.7 |
| Sep-13 | 1 | 3.6 |
| Dec-13 | -2.3 | 4.3 |
| Mar-14 | -3.9 | 4.6 |
| Jun-14 | -5 | 3.7 |
| Sep-14 | -0.5 | 3.5 |
| Dec-14 | 4.9 | 3.9 |
| Mar-15 | 14 | 0.8 |
| Jun-15 | 7.7 | 0.9 |
| Sep-15 | 5.5 | 0.7 |
| Dec-15 | -6.6 | 3.4 |
| Mar-16 | -7.4 | 0.6 |
| Jun-16 | 4.9 | 6.2 |
| Sep-16 | 6.2 | 5.3 |
| Dec-16 | 11.8 | 1.5 |
| Mar-17 | 2.8 | 7.7 |
| Jun-17 | 6.9 | 0.5 |
| Sep-17 | 1.2 | 4 |
| Dec-17 | 1.1 | 2.8 |
| Mar-18 | 9.9 | 2 |
| Jun-18 | 1.7 | 5.6 |
| Sep-18 | 11.3 | 1 |
| Dec-18 | 5.8 | -2.1 |
| Mar-19 | 5.4 | 3.7 |
| Jun-19 | 5.7 | -0.3 |
| Sep-19 | 4.2 | 2.1 |
| Dec-19 | 7.9 | 6.2 |
| Mar-20 | 2 | 0 |
| Jun-20 | -32.7 | -6.9 |
“Tourism is more prone to fluctuations in hours worked, but the 32.7 percent drop in the June 2020 quarter is a record low and four times larger than the next worst fall. This shows how much the lockdown and ongoing COVID-19 impacts have disproportionately impacted tourism industries,” Mr Neal said.
The lockdown restrictions impacted non-tourism industries as well but to a lesser extent – hours worked decreased 6.9 percent in the June 2020 quarter compared with the June 2019 quarter.
| Quarter | Key tourism industries | Non-tourism industries |
| Mar-10 | 683 | 984.00 |
| Jun-10 | 676 | 990.00 |
| Sep-10 | 691 | 996.00 |
| Dec-10 | 708 | 1015.00 |
| Mar-11 | 744 | 1019.00 |
| Jun-11 | 722 | 1029.00 |
| Sep-11 | 739 | 1035.00 |
| Dec-11 | 751 | 1039.00 |
| Mar-12 | 775 | 1053.00 |
| Jun-12 | 755 | 1060.00 |
| Sep-12 | 754 | 1067.00 |
| Dec-12 | 790 | 1068.00 |
| Mar-13 | 794 | 1080.00 |
| Jun-13 | 775 | 1081.00 |
| Sep-13 | 793 | 1094.00 |
| Dec-13 | 795 | 1100.00 |
| Mar-14 | 803 | 1117.00 |
| Jun-14 | 791 | 1112.00 |
| Sep-14 | 785 | 1117.00 |
| Dec-14 | 827 | 1126.00 |
| Mar-15 | 810 | 1138.00 |
| Jun-15 | 816 | 1145.00 |
| Sep-15 | 819 | 1150.00 |
| Dec-15 | 826 | 1162.00 |
| Mar-16 | 836 | 1161.00 |
| Jun-16 | 836 | 1168.00 |
| Sep-16 | 831 | 1174.00 |
| Dec-16 | 844 | 1181.00 |
| Mar-17 | 825 | 1191.00 |
| Jun-17 | 835 | 1198.00 |
| Sep-17 | 823 | 1207.00 |
| Dec-17 | 852 | 1223.00 |
| Mar-18 | 900 | 1232.00 |
| Jun-18 | 866 | 1235.00 |
| Sep-18 | 890 | 1241.00 |
| Dec-18 | 907 | 1255.00 |
| Mar-19 | 917 | 1272.00 |
| Jun-19 | 920 | 1280.00 |
| Sep-19 | 908 | 1287.00 |
| Dec-19 | 934 | 1300.00 |
| Mar-20 | 954 | 1313.00 |
| Jun-20 | 844 | 1280.00 |
The quarterly employment survey reported that tourism industries have tended toward lower weekly earnings per full-time equivalent employee than non-tourism industries.
Workers in tourism industries received $844 (including any wage subsidies) in the June 2020 quarter – $76 less per week on average, than in the June 2019 quarter. Meanwhile, earnings remained flat at $1,280 over the year for workers in non-tourism industries.
“Nearly 90 percent of businesses in tourism industries received the wage subsidy by May 20, compared with less than 60 percent of non-tourism businesses,” Mr. Neal said.
“If funds received from the wage subsidy were removed from these businesses, and no other changes occurred to staffing, their average weekly wages would in theory have been $244 instead of $844. The $600 difference is not unexpected given the wage subsidy was $585.80 per week for full-time employees.”
Fall in tourism industries hours felt across ethnicities and regions
People employed in tourism industries worked far fewer hours than a year ago. Māori, Asian, European, and Pacific people employed in tourism industries had falls in hours worked of around 30 percent, which was a significantly greater drop than hours worked by those in non-tourism industries.
| | Key tourism industries |
| European | -29.9 |
| Māori | -36.4 |
| Asian | -34.8 |
| Pacific peoples | -31.2 |
| -38.3 | -21.5 |
|---|---|
| -51.1 | -21.6 |
| -44.7 | -25 |
| -54.6 | -7.8 |
| | Non-tourism industries |
| European | -5.9 |
| Māori | -7.4 |
| Asian | -6.6 |
| Pacific peoples | -12 |
| -8.2 | -3.7 |
|---|---|
| -12.2 | -2.6 |
| -13.3 | 0.1 |
| -22.1 | -1.9 |
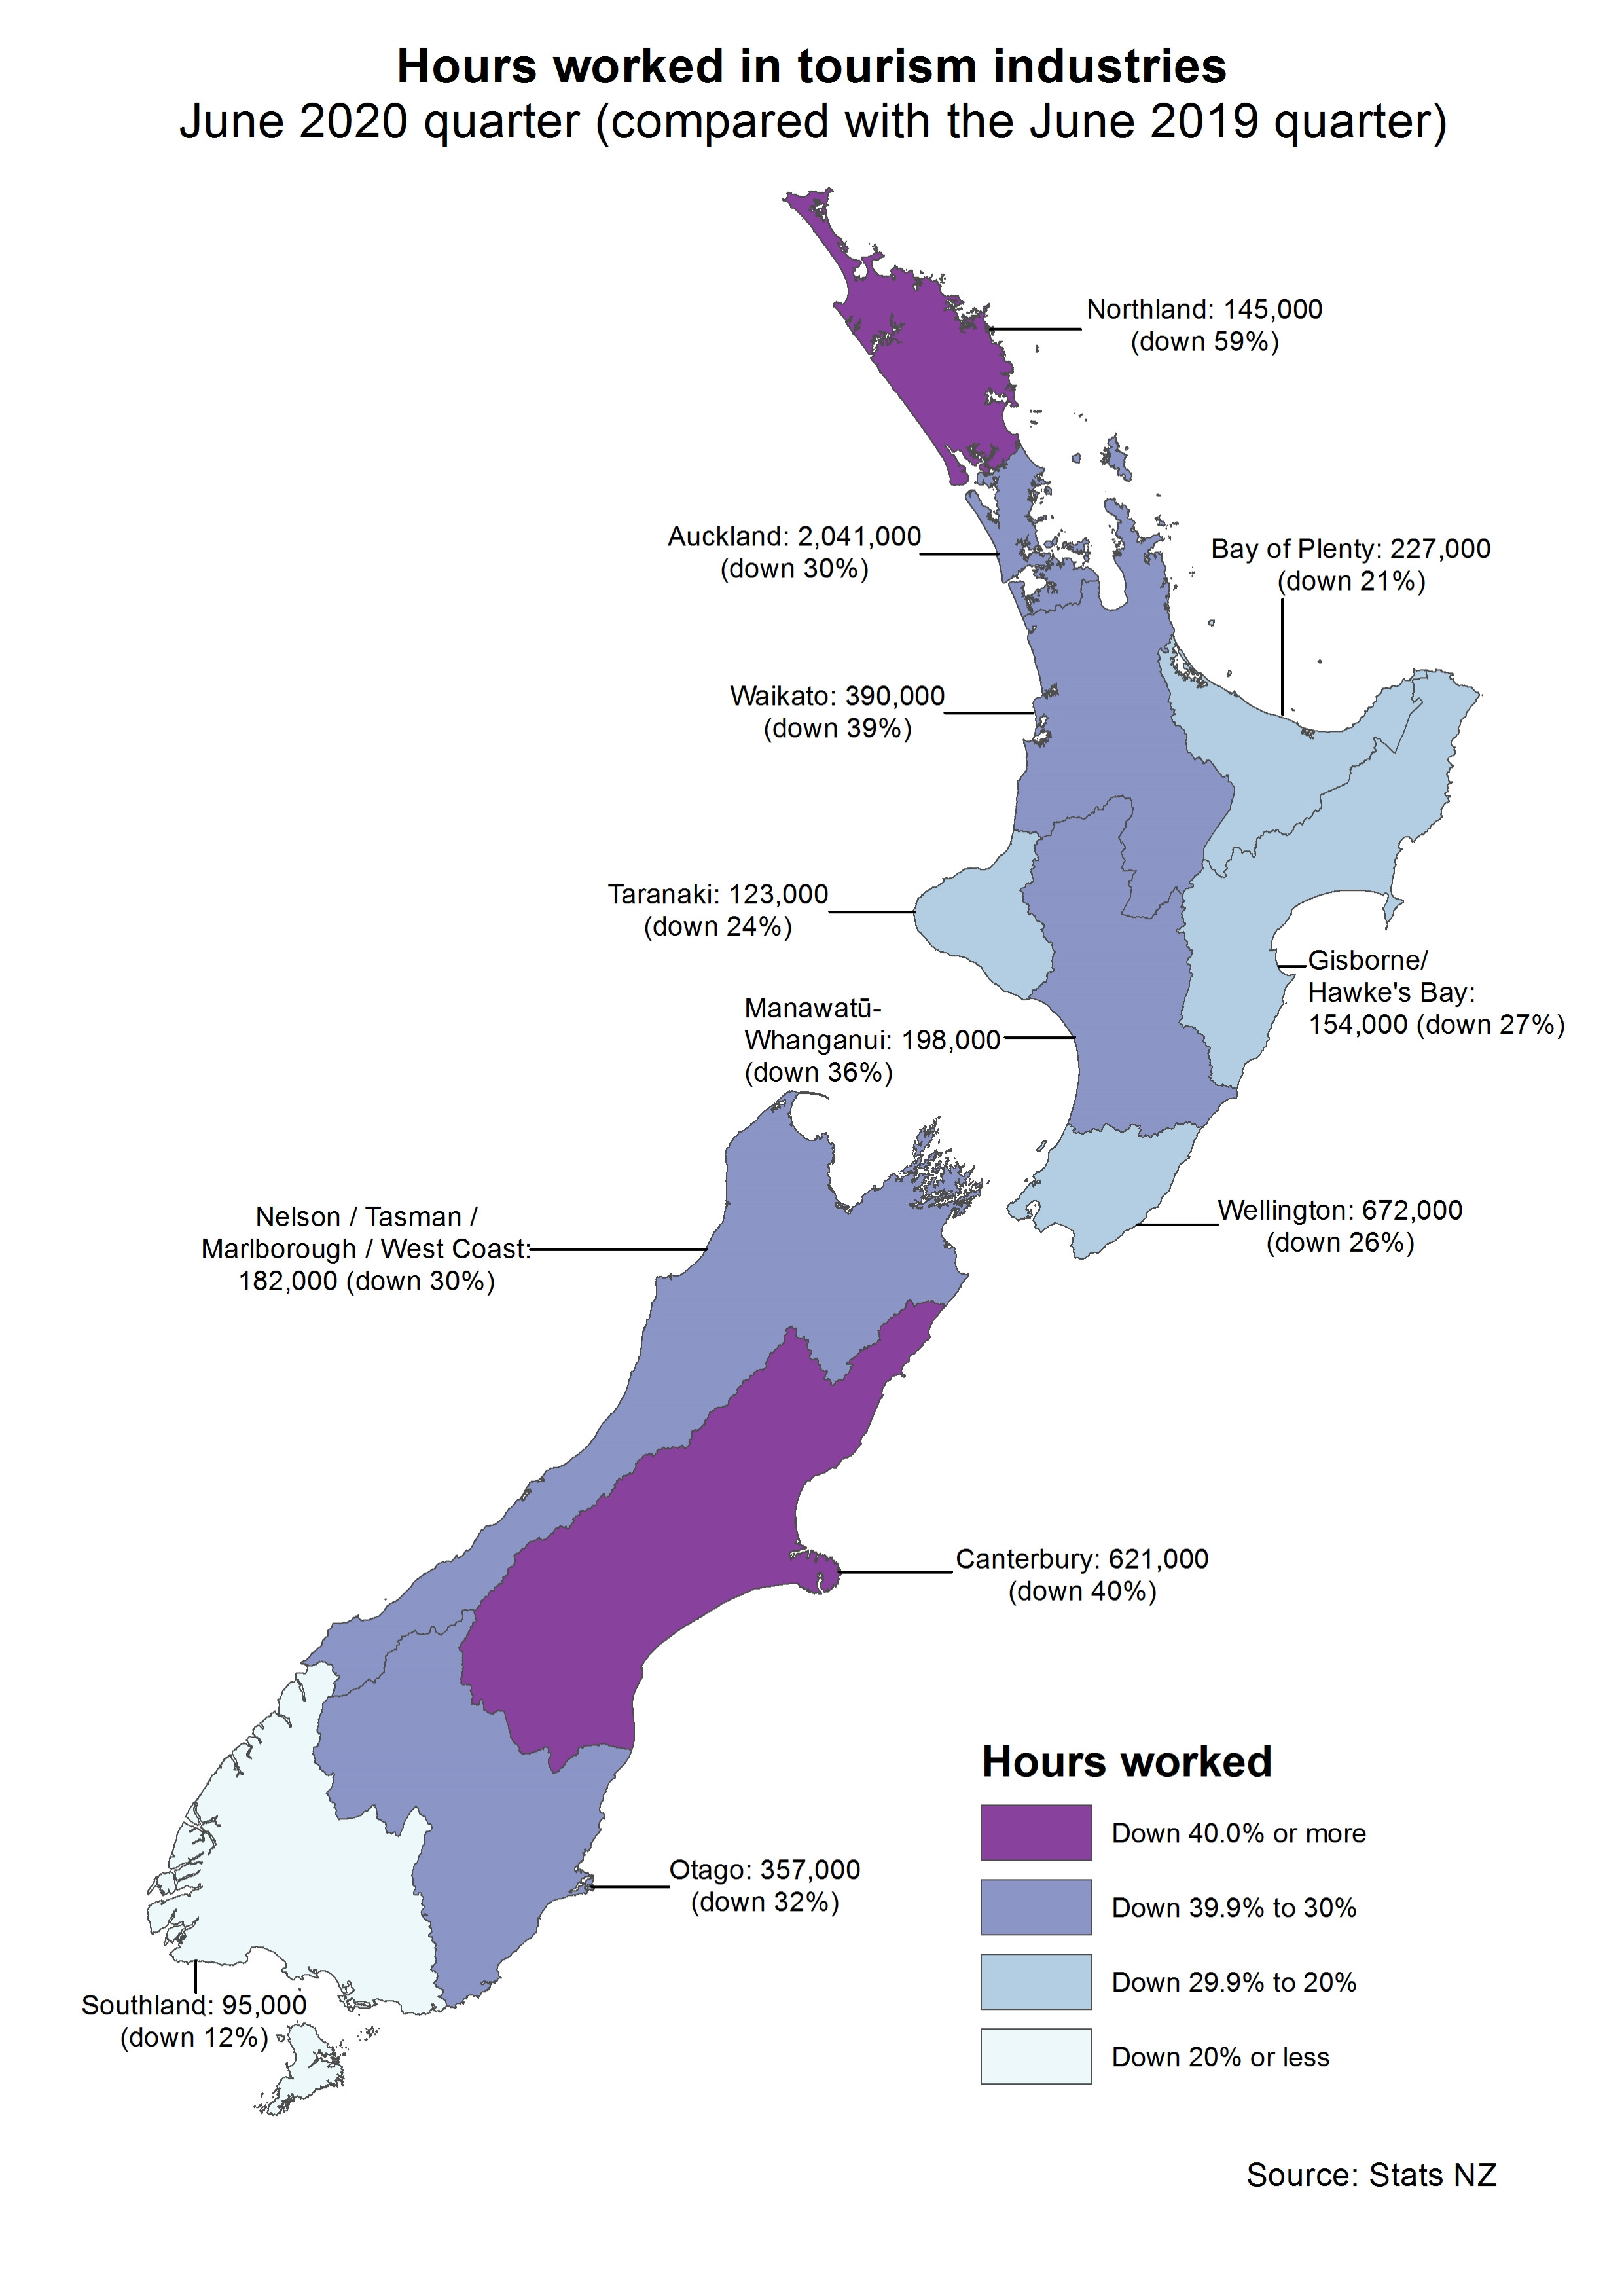
Hours worked dropped across most regions for workers in tourism industries. Regions that experienced significant decreases in the number of hours worked were Northland, Auckland, Waikato, Manawatū-Whanganui, Wellington, Nelson / Tasman / Marlborough / West Coast, Canterbury, and Otago.
Technical note on tourism-characteristic industries
Tourism is not one industry but is defined as a group of industries that produce services purchased by tourists. Industries classified as tourism-characteristic industries include accommodation, food and beverage services, air and space transport, scenic and sightseeing, travel agency and tour arrangement, and arts and recreation services.
The tourism satellite account (TSA) defines a tourism-characteristic industry as one in which:
- at least 25 percent of its output is purchased by tourists, or
- its output includes a tourism-characteristic product.
A tourism-characteristic product is one that ceases to exist in meaningful quantity, or for which the level of consumption is significantly reduced, in the absence of tourists. A product is classified as a tourism-characteristic product if at least 25 percent of its production is purchased by tourists.
The employment data is sourced from the household labour force survey (HLFS), and the measure of employment in tourism-characteristic industries is based on individual responses. The source, estimates, and dimensions differ to the TSA, which uses linked employer-employee data and allocates a person to the industry they have generated the most earnings from in a tax year.
More timely data can be produced using quarterly surveys like the HLFS, but it should only be considered a broad indication of how industries that rely heavily on tourism are faring, rather than a definitive and comprehensive reporting measure like the TSA produces. Employment in tourism industries (as presented) does not equate to tourism employment. Tourism employment is derived exclusively in the TSA using expenditure proportions to reflect the share of an industry’s employment total that can be attributed to tourism.
See Appendix 4 in Tourism satellite account: 2019 for tourism industry concordance. The key tourism industries align closely but not exactly with the tourism characteristic industries in the TSA.
Key tourism industry tables
| Sex | Jun-19 qtr | Jun-20 qtr |
| Female | 135,300 | 124,000 |
| Male | 120,400 | 121,900 |
| Ethnic group | Jun-19 qtr | Jun-20 qtr |
| Māori | 28,600 | 23,800 |
| European | 157,400 | 153,100 |
| Asian | 66,000 | 65,400 |
| Pacific | 13,100 | 13,600 |
| 1. Ethnic groups in this table are created using the total response output method and will not sum to the population total. | ||
Region | Female | Male | ||
Jun-19 qtr | Jun-20 qtr | Jun-19 qtr | Jun-20 qtr | |
Northland | 177,000 | 64,000 | 174,000 | 81,000 |
Auckland | 1,306,000 | 847,000 | 1,630,000 | 1,194,000 |
Waikato | 365,000 | 202,000 | 275,000 | 188,000 |
Bay of Plenty | 177,000 | 141,000 | 110,000 | 86,000 |
Gisborne/Hawke’s Bay | 104,000 | 72,000 | 105,000 | 81,000 |
Taranaki | 74,000 | 55,000 | 88,000 | 68,000 |
Manawatū-Whanganui | 156,000 | 111,000 | 155,000 | 87,000 |
Wellington | 359,000 | 290,000 | 546,000 | 382,000 |
Tasman/Nelson, Marlborough, West Coast | 133,000 | 76,000 | 125,000 | 106,000 |
Canterbury | 538,000 | 289,000 | 500,000 | 333,000 |
Otago | 234,000 | 149,000 | 294,000 | 208,000 |
Southland | 77,000 | 63,000 | 30,000 | 31,000 |
Text alternative for Hours worked in key tourism industries, June 2020 quarter (compared with the June 2019 quarter)
Image is of a New Zealand map, colour coded by region based on the following variables for people employed in key tourism industries: number of hours worked in the June 2020 quarter, and the annual percent change in hours worked compared with the June 2019 quarter.
- Northland was 145,000, down 59% from last year, and the change is significant.
- Auckland was 2,041,000, down 30% from last year, and the change is significant.
- Waikato was 390,000, down 39% from last year, and the change is significant.
- Bay of Plenty was 227,000, down 21% from last year, and the change is not significant.
- Gisborne/Hawke’s Bay was 154,000, down 27% from last year, and the change is not significant.
- Taranaki was 123,000, down 24% from last year, and the change is not significant.
- Manawatū -Whanganui was 198,000, down 36% from last year, and the change is significant.
- Wellington was 672,000, down 26% from last year, and the change is significant.
- Tasman/Nelson, Marlborough, West Coast was 182,000, down 30% from last year, and the change is significant.
- Canterbury was 621,000, down 40% from last year, and the change is significant.
- Otago was 357,000, down 32% from last year, and the change is significant.
- Southland was 95,000, down 12% from last year, and the change is not significant.


