Sixty percent of Aotearoa New Zealand’s highly erodible land was in the North Island in 2022, according to data released by Stats NZ today. This is despite the North Island comprising only 43 percent of New Zealand’s total land area.
“New Zealand experiences high levels of soil erosion due to steep terrain, high rainfall, and earthquakes,” environment and agricultural statistics senior manager Stuart Jones said.
Findings are consistent with those reported in 2019, although they are based on higher resolution data to 2022.
Soil erosion can impact land productivity, water quality, the natural shape of the land, and infrastructure.
Stats NZ has updated its highly erodible land and estimated long-term soil erosion environmental indicators to the end of 2022, using modelled data from Manaaki Whenua – Landcare Research. The indicators show long-term soil erosion levels, and the amount of land at risk of landslide, earthflow erosion, and gully erosion.
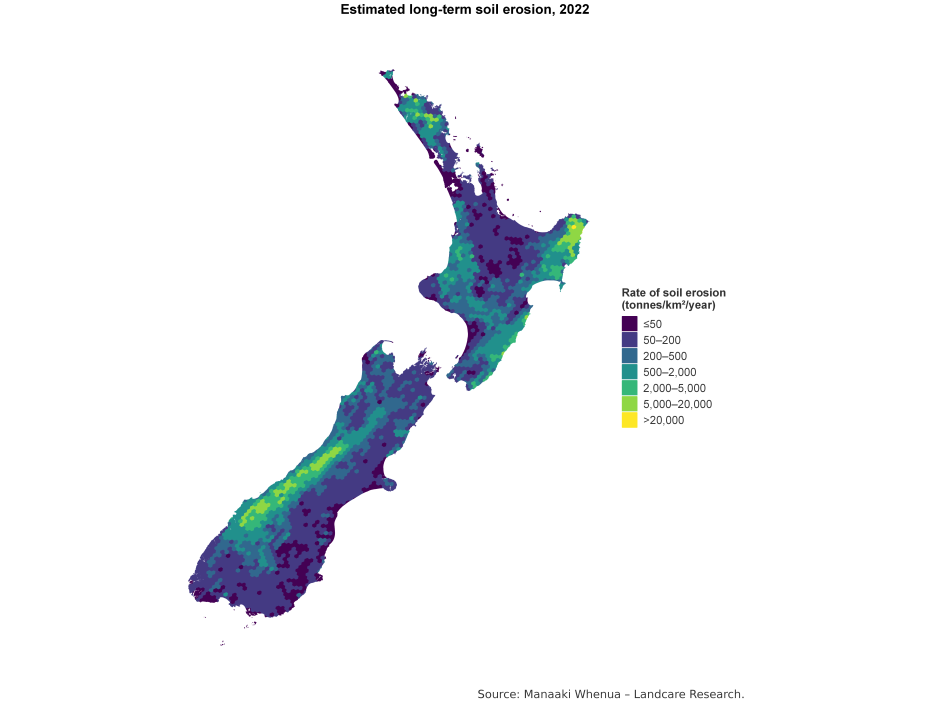
Text alternative for Estimated long-term soil erosion, 2022
A map of New Zealand represents a snapshot of the estimated long-term soil erosion (million tonnes per km2 per year) around New Zealand in 2022. The map shows hexagonal grid cells coloured one of seven colours, according to the range in the rate of soil erosion, from less than or equal to 0.01 million tonnes per km2 per year to greater than 1.50 million tonnes per km2 per year.
Of all regions, Gisborne had the highest proportion of its land classified as highly erodible land (15 percent, 1,280 km²) in 2022. Gisborne also had the second highest amount of eroded soil washed into waterways (36 million tonnes) in 2022 based on the model.
Hot spots of high landslide risk where sediment is washed into streams were identified in many areas across New Zealand. Hot spots represent areas with significantly higher proportions of highly erodible land compared, on average, with the whole of New Zealand. The Gisborne region had the highest proportion of very likely hot spots for high landslide risk where sediment is washed into streams (47 percent).
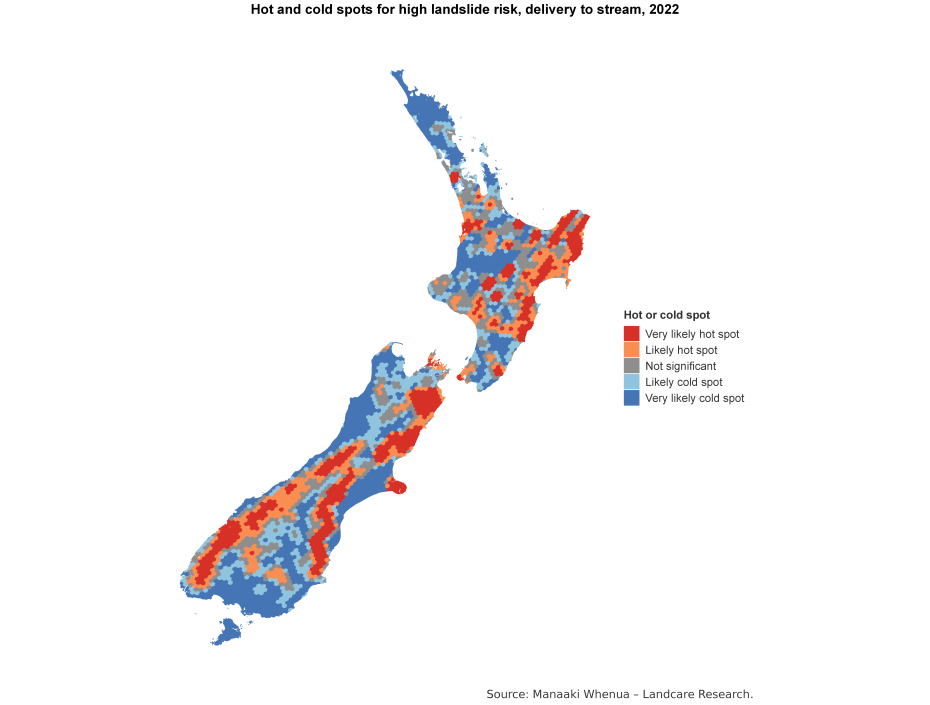
Text alternative for Hot and cold spots for high landslide risk, delivery to stream, 2022
This map of New Zealand shows hexagonal grid cells coloured according to whether an area is a hot spot or a cold spot for high landslide risk (delivery to stream), 2022. Red represents a very likely hot spot with 90 percent confidence. Light red represents a likely hot spot with 66 percent confidence. Grey represents no significant hot spot or cold spot. Light blue represents a likely cold spot with 66 percent confidence. Dark blue represents a very likely cold spot with 90 percent confidence.
As the latest data is to the end of 2022, it does not include the extreme weather events of Cyclones Hale and Gabrielle, which occurred in 2023.
Stats NZ also published its marine non-indigenous species environmental indicator today, where 73 additional non-indigenous species were detected in Aotearoa New Zealand waters since the 2009 national review. Forty-four of these are populations established between 2010 and 2022.
As part of a joint Environmental Reporting programme with partner Ministry for the Environment, Stats NZ publishes and updates environmental indicators on the pressures, state, and impacts of New Zealand’s environment including air, marine, fresh water, land, and atmosphere and climate. The highly erodible land and estimated long-term soil erosion indicators are part of a larger group that will inform the Ministry for the Environment and Stats NZ’s New Zealand’s environmental reporting series: Our land 2024 report, to be published on 10 April 2024.


