As more people move to the Queenstown-Lakes and Central Otago districts, the centre of Otago’s population is shifting west, according to data released by Stats NZ.
“As of June 2025, 52 percent of the Otago population lived in Dunedin city, while a further 21 percent lived in the Queenstown-Lakes district,” population estimates and projections spokesperson Kim Dunstan said.
“This is very different to 1996, when 64 percent of Otago residents lived in Dunedin and just 8 percent in Queenstown-Lakes.”
By the 2050s, less than half of Otago’s population could be living in Dunedin, and nearly 40 percent in either the Queenstown-Lakes or Central Otago districts (according to Stats NZ’s medium projection).
| Territorial authority area | 1996 | 2025 | 2053 (medium projection) |
| Waitaki district | 11 | 9 | 8 |
| Central Otago district | 8 | 10 | 12 |
| Queenstown-Lakes district | 8 | 21 | 27 |
| Dunedin city | 64 | 52 | 47 |
| Clutha district | 10 | 7 | 6 |
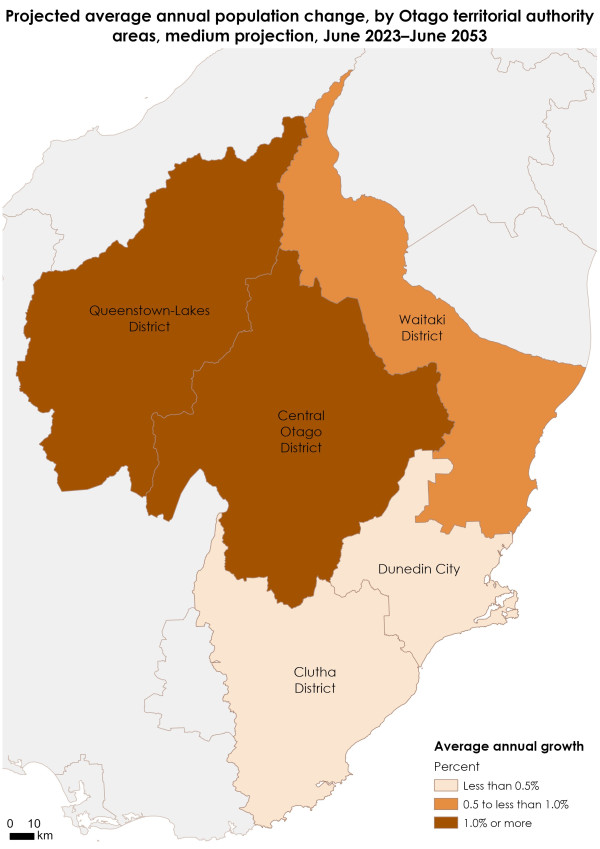
The population of all five Otago territorial authority areas is projected to grow between 2023 and 2053 (medium projection), but growth rates will vary across the region:
- Clutha district and Dunedin city are projected to grow at an average annual rate of 0.3 and 0.4 percent, respectively
- Waitaki district is projected to grow at an average annual rate of 0.7 percent
- Queenstown-Lakes and Central Otago districts are projected to grow at an average annual rate of 1.7 and 1.4 percent, respectively, which is higher than the national average of 0.9 percent.
Queenstown-Lakes population growing rapidly
“Since the 1990s, the Queenstown-Lakes district has been one of New Zealand’s fastest growing areas. The estimated resident population has more than tripled since 1996, reaching 53,800 in June 2025,” Dunstan said.
Meanwhile, in Dunedin city, population growth has been much slower. The estimated resident population of Dunedin was 132,800 people as of June 2025, an increase of 12,000 since 1996. The average annual growth rate was 0.3 percent between 1996 and 2025.
| Year | Dunedin ERP |
| 1996 | 120800 |
| 1997 | 120400 |
| 1998 | 120200 |
| 1999 | 119900 |
| 2000 | 119600 |
| 2001 | 119300 |
| 2002 | 120200 |
| 2003 | 120900 |
| 2004 | 121600 |
| 2005 | 122000 |
| 2006 | 122300 |
| 2007 | 121900 |
| 2008 | 121700 |
| 2009 | 121900 |
| 2010 | 122400 |
| 2011 | 123100 |
| 2012 | 123500 |
| 2013 | 123500 |
| 2014 | 124900 |
| 2015 | 126600 |
| 2016 | 128400 |
| 2017 | 129900 |
| 2018 | 131200 |
| 2019 | 131600 |
| 2020 | 133200 |
| 2021 | 132200 |
| 2022 | 131300 |
| 2023 | 131300 |
| 2024 | 132900 |
| 2025 | 132800 |
| Year | Dunedin low projection |
| 1996 | |
| 1997 | |
| 1998 | |
| 1999 | |
| 2000 | |
| 2001 | |
| 2002 | |
| 2003 | |
| 2004 | |
| 2005 | |
| 2006 | |
| 2007 | |
| 2008 | |
| 2009 | |
| 2010 | |
| 2011 | |
| 2012 | |
| 2013 | |
| 2014 | |
| 2015 | |
| 2016 | |
| 2017 | |
| 2018 | |
| 2019 | |
| 2020 | |
| 2021 | |
| 2022 | |
| 2023 | |
| 2024 | |
| 2025 | |
| 2026 | |
| 2027 | |
| 2028 | 129800 |
| 2029 | |
| 2030 | |
| 2031 | |
| 2032 | |
| 2033 | 129500 |
| 2034 | |
| 2035 | |
| 2036 | |
| 2037 | |
| 2038 | 129300 |
| 2039 | |
| 2040 | |
| 2041 | |
| 2042 | |
| 2043 | 129200 |
| 2044 | |
| 2045 | |
| 2046 | |
| 2047 | |
| 2048 | 129000 |
| 2049 | |
| 2050 | |
| 2051 | |
| 2052 | |
| 2053 | 128900 |
| Year | Dunedin medium projection |
| 1996 | |
| 1997 | |
| 1998 | |
| 1999 | |
| 2000 | |
| 2001 | |
| 2002 | |
| 2003 | |
| 2004 | |
| 2005 | |
| 2006 | |
| 2007 | |
| 2008 | |
| 2009 | |
| 2010 | |
| 2011 | |
| 2012 | |
| 2013 | |
| 2014 | |
| 2015 | |
| 2016 | |
| 2017 | |
| 2018 | |
| 2019 | |
| 2020 | |
| 2021 | |
| 2022 | |
| 2023 | |
| 2024 | |
| 2025 | |
| 2026 | |
| 2027 | |
| 2028 | 132800 |
| 2029 | |
| 2030 | |
| 2031 | |
| 2032 | |
| 2033 | 135400 |
| 2034 | |
| 2035 | |
| 2036 | |
| 2037 | |
| 2038 | 138100 |
| 2039 | |
| 2040 | |
| 2041 | |
| 2042 | |
| 2043 | 141000 |
| 2044 | |
| 2045 | |
| 2046 | |
| 2047 | |
| 2048 | 143900 |
| 2049 | |
| 2050 | |
| 2051 | |
| 2052 | |
| 2053 | 146900 |
| Year | Dunedin high projection |
| 1996 | |
| 1997 | |
| 1998 | |
| 1999 | |
| 2000 | |
| 2001 | |
| 2002 | |
| 2003 | |
| 2004 | |
| 2005 | |
| 2006 | |
| 2007 | |
| 2008 | |
| 2009 | |
| 2010 | |
| 2011 | |
| 2012 | |
| 2013 | |
| 2014 | |
| 2015 | |
| 2016 | |
| 2017 | |
| 2018 | |
| 2019 | |
| 2020 | |
| 2021 | |
| 2022 | |
| 2023 | |
| 2024 | |
| 2025 | |
| 2026 | |
| 2027 | |
| 2028 | 135900 |
| 2029 | |
| 2030 | |
| 2031 | |
| 2032 | |
| 2033 | 141300 |
| 2034 | |
| 2035 | |
| 2036 | |
| 2037 | |
| 2038 | 147000 |
| 2039 | |
| 2040 | |
| 2041 | |
| 2042 | |
| 2043 | 153000 |
| 2044 | |
| 2045 | |
| 2046 | |
| 2047 | |
| 2048 | 158900 |
| 2049 | |
| 2050 | |
| 2051 | |
| 2052 | |
| 2053 | 164900 |
| Year | Queenstown-Lakes ERP |
| 1996 | 14800 |
| 1997 | 15400 |
| 1998 | 15750 |
| 1999 | 16100 |
| 2000 | 16750 |
| 2001 | 17850 |
| 2002 | 19150 |
| 2003 | 20400 |
| 2004 | 21800 |
| 2005 | 22900 |
| 2006 | 24100 |
| 2007 | 25400 |
| 2008 | 26300 |
| 2009 | 26900 |
| 2010 | 27500 |
| 2011 | 28400 |
| 2012 | 28800 |
| 2013 | 29700 |
| 2014 | 31300 |
| 2015 | 33400 |
| 2016 | 36100 |
| 2017 | 39000 |
| 2018 | 42500 |
| 2019 | 44600 |
| 2020 | 47100 |
| 2021 | 47300 |
| 2022 | 47700 |
| 2023 | 51500 |
| 2024 | 52900 |
| 2025 | 53800 |
| Year | Queenstown-Lakes low projection |
| 1996 | |
| 1997 | |
| 1998 | |
| 1999 | |
| 2000 | |
| 2001 | |
| 2002 | |
| 2003 | |
| 2004 | |
| 2005 | |
| 2006 | |
| 2007 | |
| 2008 | |
| 2009 | |
| 2010 | |
| 2011 | |
| 2012 | |
| 2013 | |
| 2014 | |
| 2015 | |
| 2016 | |
| 2017 | |
| 2018 | |
| 2019 | |
| 2020 | |
| 2021 | |
| 2022 | |
| 2023 | |
| 2024 | |
| 2025 | |
| 2026 | |
| 2027 | |
| 2028 | 55900 |
| 2029 | |
| 2030 | |
| 2031 | |
| 2032 | |
| 2033 | 59700 |
| 2034 | |
| 2035 | |
| 2036 | |
| 2037 | |
| 2038 | 63200 |
| 2039 | |
| 2040 | |
| 2041 | |
| 2042 | |
| 2043 | 66600 |
| 2044 | |
| 2045 | |
| 2046 | |
| 2047 | |
| 2048 | 69900 |
| 2049 | |
| 2050 | |
| 2051 | |
| 2052 | |
| 2053 | 73200 |
| Year | Queenstown-Lakes medium projection |
| 1996 | |
| 1997 | |
| 1998 | |
| 1999 | |
| 2000 | |
| 2001 | |
| 2002 | |
| 2003 | |
| 2004 | |
| 2005 | |
| 2006 | |
| 2007 | |
| 2008 | |
| 2009 | |
| 2010 | |
| 2011 | |
| 2012 | |
| 2013 | |
| 2014 | |
| 2015 | |
| 2016 | |
| 2017 | |
| 2018 | |
| 2019 | |
| 2020 | |
| 2021 | |
| 2022 | |
| 2023 | |
| 2024 | |
| 2025 | |
| 2026 | |
| 2027 | |
| 2028 | 57600 |
| 2029 | |
| 2030 | |
| 2031 | |
| 2032 | |
| 2033 | 63100 |
| 2034 | |
| 2035 | |
| 2036 | |
| 2037 | |
| 2038 | 68500 |
| 2039 | |
| 2040 | |
| 2041 | |
| 2042 | |
| 2043 | 73700 |
| 2044 | |
| 2045 | |
| 2046 | |
| 2047 | |
| 2048 | 79000 |
| 2049 | |
| 2050 | |
| 2051 | |
| 2052 | |
| 2053 | 84400 |
| Year | Queenstown-Lakes high projection |
| 1996 | |
| 1997 | |
| 1998 | |
| 1999 | |
| 2000 | |
| 2001 | |
| 2002 | |
| 2003 | |
| 2004 | |
| 2005 | |
| 2006 | |
| 2007 | |
| 2008 | |
| 2009 | |
| 2010 | |
| 2011 | |
| 2012 | |
| 2013 | |
| 2014 | |
| 2015 | |
| 2016 | |
| 2017 | |
| 2018 | |
| 2019 | |
| 2020 | |
| 2021 | |
| 2022 | |
| 2023 | |
| 2024 | |
| 2025 | |
| 2026 | |
| 2027 | |
| 2028 | 59400 |
| 2029 | |
| 2030 | |
| 2031 | |
| 2032 | |
| 2033 | 66600 |
| 2034 | |
| 2035 | |
| 2036 | |
| 2037 | |
| 2038 | 73700 |
| 2039 | |
| 2040 | |
| 2041 | |
| 2042 | |
| 2043 | 80800 |
| 2044 | |
| 2045 | |
| 2046 | |
| 2047 | |
| 2048 | 87900 |
| 2049 | |
| 2050 | |
| 2051 | |
| 2052 | |
| 2053 | 95100 |
Population projections indicate that higher growth in Queenstown-Lakes is likely to continue, while growth in Dunedin city is likely to remain slower.
Assuming net migration of about 800 people a year, the Queenstown-Lakes population is projected to reach 84,400 in 2053 (medium projection). This is almost six times the district’s population in 1996. However, if net migration averaged 1,100 a year, the population could reach 95,100 in 2053 (high projection).
“If net migration was even higher ─ for example 1,700 a year, closer to the average over the last decade ─ the Queenstown-Lakes population could eclipse 110,000 by 2053,” Dunstan said.
“These are projections of the resident population. For areas like Queenstown-Lakes, the large number of visitors passing through also has an impact on service and infrastructure needs.”
Over the same period, 2023 to 2053, the population of Dunedin city is projected to increase at an average annual rate of 0.4 percent, reaching 146,900 in 2053 (medium projection). Dunedin would then account for 47 percent of Otago’s population.
Population projections are based on assumptions about future fertility, mortality, and migration. The projections assume current policy settings and do not try to anticipate future major policy changes that may affect population change.
Migration driving growth in Queenstown-Lakes
Population growth in Queenstown-Lakes has been largely driven by migration. Net migration to the district peaked in the 2014─2018 period, with an average gain of 2,200 people a year. This dropped to an average of 1,500 people a year in the 2019-2023 period, partly due to two years of unusual international migration loss during the COVID-19 pandemic.
Net migration is the difference between migrant arrivals and migrant departures, and includes both international and internal (within New Zealand) migration. Patterns of migration are influenced by economic, policy, environmental, and social factors.
Natural increase has also contributed to population growth in the Queenstown-Lakes district, currently adding an average of 420 people a year. Natural increase is the difference between the number of live births and the number of deaths in an area.
Population projections indicate that natural increase in Queenstown-Lakes could decline from 2028, a trend occurring throughout New Zealand, as population ageing sees deaths increase faster than births.
| Period ended June | Net migration | Natural increase |
| 1982-1986 | 350 | 60 |
| 1987-1991 | 230 | 100 |
| 1992-1996 | 740 | 120 |
| 1997-2001 | 470 | 140 |
| 2002-2006 | 1100 | 180 |
| 2007-2013 | 490 | 310 |
| 2014-2018 | 2200 | 310 |
| 2019-2023 | 1500 | 360 |
| 2024-2028 | 800 | 420 |
| 2029-2033 | 740 | 360 |
| 2034-2038 | 790 | 280 |
| 2039-2043 | 840 | 210 |
| 2044-2048 | 890 | 170 |
| 2049-2053 | 940 | 130 |
Both international and internal migration have played an important role in population growth in the Queenstown-Lakes district. In 2023, 8 percent of Queenstown-Lakes residents had been living overseas five years earlier, while 14 percent had been living in the North Island. In total, 41 percent of the district’s population was born overseas in 2023, compared with 16 percent in 1996.
Dunedin the first of New Zealand’s major cities to experience natural decrease
Net migration to Dunedin city has fluctuated over the last thirty years, influenced by economic, environmental, and societal factors. In contrast, natural increase has been generally declining.
“Dunedin city has been experiencing natural decrease since 2023, meaning there were more deaths than births,” Dunstan said.
“While a decline in natural increase is occurring across New Zealand, Dunedin was the first of New Zealand’s major cities to experience natural decrease.”
Natural decrease in Dunedin city is projected to continue as the population ages, but this is likely to be offset by net migration, resulting in small population increases (medium projection).
| Period ended June | Net migration | Natural increase |
| 1982-1986 | -350 | 410 |
| 1987-1991 | -380 | 470 |
| 1992-1996 | 190 | 540 |
| 1997-2001 | -650 | 350 |
| 2002-2006 | 320 | 290 |
| 2007-2013 | -150 | 320 |
| 2014-2018 | 1300 | 180 |
| 2019-2023 | -60 | 80 |
| 2024-2028 | 400 | -110 |
| 2029-2033 | 650 | -130 |
| 2034-2038 | 700 | -160 |
| 2039-2043 | 750 | -170 |
| 2044-2048 | 800 | -200 |
| 2049-2053 | 850 | -250 |
Growth in number of new homes
As the populations of the Queenstown-Lakes and Central Otago districts have increased, so has the number of new homes.
Of New Zealand’s 67 territorial authority areas and 21 Auckland local board areas, Queenstown-Lakes had the highest number of new homes consented per 1,000 residents at 35.5 in the year ended May 2026. This was the fifth consecutive year that Queenstown-Lakes had the highest ratio of new homes consented to population. The ratio in Central Otago was also high, at 11.6 homes consented per 1,000 residents.
In Dunedin city (3.6 per 1,000), and the Waitaki (3.7) and Clutha (3.2) districts, the ratio was lower than the national average of 7.5 in the year ended May 2026.
Most consents eventually result in new homes. New homes may be for residents, visitor accommodation, or used as holiday homes.
| Year ended May | Queenstown-Lakes district | Central Otago district | New Zealand | Waitaki district | Dunedin city | Clutha district |
| 2007 | 27.9 | 15.2 | 6.2 | 5.2 | 3.7 | 3.9 |
| 2008 | 21.3 | 15.9 | 5.8 | 5.7 | 3.4 | 5.1 |
| 2009 | 15 | 10.4 | 3.4 | 3.7 | 1.7 | 3.3 |
| 2010 | 15.1 | 8.2 | 3.7 | 3.2 | 2.8 | 3.5 |
| 2011 | 12.4 | 5.6 | 3.2 | 3.6 | 2.4 | 3.2 |
| 2012 | 11.4 | 5.7 | 3.5 | 3.3 | 2.2 | 2.3 |
| 2013 | 14.3 | 6.9 | 4.2 | 3.8 | 3.4 | 2.1 |
| 2014 | 19 | 8.3 | 5.1 | 3.1 | 3.1 | 3 |
| 2015 | 21 | 8.6 | 5.6 | 3.6 | 2.9 | 2.8 |
| 2016 | 26.1 | 11.9 | 6.2 | 3.8 | 2.6 | 2.2 |
| 2017 | 28.1 | 20.1 | 6.5 | 3.2 | 3.6 | 3.2 |
| 2018 | 32.4 | 15.7 | 6.8 | 4.8 | 3.3 | 3.6 |
| 2019 | 29.7 | 14.5 | 7.1 | 5.1 | 3.2 | 4.2 |
| 2020 | 30.8 | 11.7 | 7.4 | 4.8 | 3.4 | 3.5 |
| 2021 | 21.4 | 12.3 | 8.6 | 5.1 | 3.6 | 4.6 |
| 2022 | 29.6 | 12.9 | 10 | 6.6 | 4.7 | 5 |
| 2023 | 25.6 | 12.2 | 8.9 | 4.5 | 3.7 | 3.3 |
| 2024 | 21.2 | 10.2 | 6.7 | 3.7 | 3.3 | 2.8 |
| 2025 | 32.9 | 11.3 | 6.3 | 3.6 | 3.5 | 2.5 |
| 2026 | 35.5 | 11.6 | 7.5 | 3.7 | 3.6 | 3.2 |
More information
We have drawn together recently published population statistics to explain what is driving population change in the Otago region.
For more information about Otago’s population and other populations throughout Aotearoa New Zealand, see:
- Place and ethnic group summaries
- Subnational population estimates tables
- Subnational population projections tables.
Text alternative for map, Projected average annual population change by Otago territorial authority areas, medium projection, June 2023-June 2053
This map shows the projected average annual population change between June 2023 and June 2053 from the 2023-base medium projection for each territorial authority in the Otago region.
Areas where the projected average annual population change is less than 0.5 percent are: Clutha district, Dunedin city.
Areas where the projected average annual population change is from 0.5 percent to less than 1.0 percent are: Waitaki district.
Areas where the projected average annual population change is 1.0 percent or more are: Central Otago district, Queenstown-Lakes district.