The seasonally adjusted unemployment rate rose to 4.2 percent in the September 2019 quarter, up from 3.9 percent last quarter, Stats NZ said today.
The rise in the unemployment rate comes after a drop to an 11-year low in the June 2019 quarter, while the seasonally adjusted underutilisation rate fell to 10.4 percent.
This is the lowest underutilisation rate since the June 2008 quarter, when it was 9.9 percent.
“Labour market data is most useful when placed in the context of a time series,” prices senior manager Paul Pascoe said.
“While the unemployment rate has returned to the level seen in the March 2019 quarter, it has largely been tracking down since late 2012.”
| Quarter | Seasonally adjusted | Trend series |
| Sep-07 | 3.5 | 3.5 |
| Dec-07 | 3.3 | 3.5 |
| Mar-08 | 3.8 | 3.7 |
| Jun-08 | 3.8 | 3.8 |
| Sep-08 | 4 | 4 |
| Dec-08 | 4.4 | 4.4 |
| Mar-09 | 5 | 5 |
| Jun-09 | 5.7 | 5.7 |
| Sep-09 | 6.1 | 6.2 |
| Dec-09 | 6.5 | 6.4 |
| Mar-10 | 5.9 | 6.3 |
| Jun-10 | 6.5 | 6.1 |
| Sep-10 | 6 | 6.1 |
| Dec-10 | 6.2 | 6.1 |
| Mar-11 | 6 | 6 |
| Jun-11 | 6 | 6 |
| Sep-11 | 5.9 | 5.9 |
| Dec-11 | 6 | 6 |
| Mar-12 | 6.3 | 6.2 |
| Jun-12 | 6.3 | 6.4 |
| Sep-12 | 6.7 | 6.5 |
| Dec-12 | 6.2 | 6.2 |
| Mar-13 | 5.7 | 5.9 |
| Jun-13 | 5.9 | 5.8 |
| Sep-13 | 5.8 | 5.8 |
| Dec-13 | 5.6 | 5.7 |
| Mar-14 | 5.5 | 5.5 |
| Jun-14 | 5.2 | 5.3 |
| Sep-14 | 5.2 | 5.3 |
| Dec-14 | 5.5 | 5.4 |
| Mar-15 | 5.5 | 5.5 |
| Jun-15 | 5.4 | 5.5 |
| Sep-15 | 5.6 | 5.4 |
| Dec-15 | 4.9 | 5.2 |
| Mar-16 | 5.2 | 5.1 |
| Jun-16 | 5 | 5 |
| Sep-16 | 5 | 5 |
| Dec-16 | 5.2 | 5.1 |
| Mar-17 | 4.9 | 5 |
| Jun-17 | 4.7 | 4.9 |
| Sep-17 | 4.7 | 4.7 |
| Dec-17 | 4.5 | 4.5 |
| Mar-18 | 4.3 | 4.4 |
| Jun-18 | 4.5 | 4.3 |
| Sep-18 | 4 | 4.2 |
| Dec-18 | 4.3 | 4.2 |
| Mar-19 | 4.2 | 4.2 |
| Jun-19 | 3.9 | 4 |
| Sep-19 | 4.2 | 4.1 |
“Despite the quarterly rise in unemployment, the underutilisation rate, which is a broader measure of spare capacity in the labour market, has fallen to the lowest level in over eleven years,” Mr Pascoe said.
“The fall in underutilisation this quarter was driven by a drop in the number of underemployed people, those who work part time but are looking to work more hours.”
Overall, the seasonally adjusted number of people who were underutilised fell by 18,000, to 295,000 in the September 2019 quarter. This is the first time since the March 2009 quarter that the number of underutilised people has been below 300,000.
| Quarter | Men | Women | Total underutilisation rate |
| Sep-07 | 7.3 | 11 | 9 |
| Dec-07 | 7.5 | 11.1 | 9.2 |
| Mar-08 | 8.4 | 12.3 | 10.2 |
| Jun-08 | 8.4 | 11.6 | 9.9 |
| Sep-08 | 8.6 | 12.6 | 10.5 |
| Dec-08 | 9.3 | 13.5 | 11.3 |
| Mar-09 | 10.4 | 14.2 | 12.2 |
| Jun-09 | 11.7 | 15.8 | 13.6 |
| Sep-09 | 12.9 | 16.7 | 14.7 |
| Dec-09 | 12.7 | 17.5 | 15 |
| Mar-10 | 11.5 | 15.8 | 13.5 |
| Jun-10 | 12.3 | 16.1 | 14.1 |
| Sep-10 | 11.4 | 16.4 | 13.8 |
| Dec-10 | 11.5 | 16.5 | 13.9 |
| Mar-11 | 11.3 | 16.8 | 13.9 |
| Jun-11 | 12 | 16.2 | 14 |
| Sep-11 | 11 | 16.3 | 13.5 |
| Dec-11 | 12 | 15.4 | 13.6 |
| Mar-12 | 11.6 | 16.7 | 14 |
| Jun-12 | 11.8 | 17.7 | 14.6 |
| Sep-12 | 13.4 | 17.6 | 15.4 |
| Dec-12 | 12.2 | 17.1 | 14.6 |
| Mar-13 | 10.2 | 15.8 | 12.9 |
| Jun-13 | 10.5 | 16.1 | 13.2 |
| Sep-13 | 11 | 17.2 | 14 |
| Dec-13 | 11 | 17 | 13.9 |
| Mar-14 | 10.8 | 15.7 | 13.1 |
| Jun-14 | 10.4 | 16.3 | 13.2 |
| Sep-14 | 10.1 | 15.5 | 12.7 |
| Dec-14 | 10.4 | 16.3 | 13.2 |
| Mar-15 | 10.7 | 16.6 | 13.5 |
| Jun-15 | 10.5 | 16.8 | 13.5 |
| Sep-15 | 11.1 | 16.4 | 13.7 |
| Dec-15 | 10.1 | 14.9 | 12.4 |
| Mar-16 | 11.1 | 16.2 | 13.6 |
| Jun-16 | 10.4 | 15.8 | 13 |
| Sep-16 | 10 | 15.6 | 12.7 |
| Dec-16 | 9.6 | 15.3 | 12.4 |
| Mar-17 | 9.2 | 15.4 | 12.2 |
| Jun-17 | 9.4 | 14.5 | 11.9 |
| Sep-17 | 9.2 | 15.3 | 12.1 |
| Dec-17 | 9.3 | 15.2 | 12.1 |
| Mar-18 | 9.5 | 14.5 | 11.9 |
| Jun-18 | 9.9 | 14.3 | 12 |
| Sep-18 | 9.3 | 13.7 | 11.4 |
| Dec-18 | 9.9 | 14.5 | 12.1 |
| Mar-19 | 9 | 13.8 | 11.3 |
| Jun-19 | 9.1 | 13.1 | 11 |
| Sep-19 | 8.3 | 12.6 | 10.4 |
| Quarters | Public sector | Private sector | LCI all sectors |
| Sep-99 | 1.4 | 1.5 | 1.5 |
| Dec-99 | 1.7 | 1.5 | 1.4 |
| Mar-00 | 1.8 | 1.4 | 1.4 |
| Jun-00 | 2.4 | 1.3 | 1.6 |
| Sep-00 | 2 | 1.4 | 1.5 |
| Dec-00 | 1.8 | 1.5 | 1.6 |
| Mar-01 | 1.9 | 1.6 | 1.8 |
| Jun-01 | 1.6 | 1.9 | 1.8 |
| Sep-01 | 1.9 | 2 | 2 |
| Dec-01 | 2.2 | 2.1 | 2.1 |
| Mar-02 | 2.3 | 2.1 | 2 |
| Jun-02 | 2.3 | 2.1 | 2.1 |
| Sep-02 | 2.5 | 2.1 | 2.2 |
| Dec-02 | 2.6 | 2 | 2.1 |
| Mar-03 | 2.6 | 2.2 | 2.3 |
| Jun-03 | 2.6 | 2.2 | 2.3 |
| Sep-03 | 3 | 2.1 | 2.3 |
| Dec-03 | 2.8 | 2.2 | 2.4 |
| Mar-04 | 2.6 | 2.1 | 2.2 |
| Jun-04 | 2.7 | 2.2 | 2.3 |
| Sep-04 | 2.4 | 2.3 | 2.2 |
| Dec-04 | 2.6 | 2.5 | 2.5 |
| Mar-05 | 2.6 | 2.5 | 2.5 |
| Jun-05 | 2.9 | 2.6 | 2.7 |
| Sep-05 | 3.8 | 2.8 | 3.1 |
| Dec-05 | 3.8 | 2.9 | 3 |
| Mar-06 | 3.9 | 3 | 3.2 |
| Jun-06 | 3.7 | 2.9 | 3.1 |
| Sep-06 | 3.8 | 3 | 3.2 |
| Dec-06 | 3.8 | 3.1 | 3.2 |
| Mar-07 | 3.8 | 3 | 3.2 |
| Jun-07 | 3.6 | 3.2 | 3.3 |
| Sep-07 | 2.6 | 3.2 | 3.1 |
| Dec-07 | 2.6 | 3.4 | 3.3 |
| Mar-08 | 3.1 | 3.5 | 3.4 |
| Jun-08 | 3.9 | 3.4 | 3.6 |
| Sep-08 | 4.8 | 3.7 | 4 |
| Dec-08 | 4.7 | 3.2 | 3.5 |
| Mar-09 | 4.3 | 3.1 | 3.3 |
| Jun-09 | 3.6 | 2.7 | 2.8 |
| Sep-09 | 2.9 | 2 | 2.1 |
| Dec-09 | 2.4 | 1.6 | 1.8 |
| Mar-10 | 2.3 | 1.3 | 1.5 |
| Jun-10 | 2.1 | 1.5 | 1.6 |
| Sep-10 | 1.3 | 1.6 | 1.6 |
| Dec-10 | 1.4 | 1.9 | 1.7 |
| Mar-11 | 1.4 | 2 | 1.9 |
| Jun-11 | 1.5 | 2 | 1.9 |
| Sep-11 | 1.8 | 2 | 2 |
| Dec-11 | 1.8 | 2 | 2 |
| Mar-12 | 1.6 | 2.1 | 2 |
| Jun-12 | 1.6 | 2.1 | 2 |
| Sep-12 | 1.4 | 2.1 | 1.9 |
| Dec-12 | 1.5 | 2 | 1.8 |
| Mar-13 | 1.5 | 1.8 | 1.7 |
| Jun-13 | 1.5 | 1.8 | 1.7 |
| Sep-13 | 1.6 | 1.7 | 1.7 |
| Dec-13 | 1.4 | 1.7 | 1.6 |
| Mar-14 | 1.2 | 1.7 | 1.6 |
| Jun-14 | 1.2 | 1.8 | 1.7 |
| Sep-14 | 1 | 1.9 | 1.6 |
| Dec-14 | 1.2 | 1.8 | 1.8 |
| Mar-15 | 1.2 | 1.8 | 1.7 |
| Jun-15 | 1.2 | 1.8 | 1.6 |
| Sep-15 | 1.2 | 1.7 | 1.6 |
| Dec-15 | 1.2 | 1.6 | 1.5 |
| Mar-16 | 1.4 | 1.8 | 1.6 |
| Jun-16 | 1.3 | 1.6 | 1.5 |
| Sep-16 | 1.7 | 1.6 | 1.6 |
| Dec-16 | 1.8 | 1.6 | 1.6 |
| Mar-17 | 1.7 | 1.5 | 1.6 |
| Jun-17 | 1.9 | 1.6 | 1.7 |
| Sep-17 | 1.5 | 1.9 | 1.9 |
| Dec-17 | 1.5 | 1.9 | 1.8 |
| Mar-18 | 1.5 | 1.9 | 1.8 |
| Jun-18 | 1.4 | 2.1 | 1.9 |
| Sep-18 | 1.5 | 1.9 | 1.8 |
| Dec-18 | 1.7 | 2 | 1.9 |
| Mar-19 | 2 | 2 | 2 |
| Jun-19 | 2.2 | 2.2 | 2.1 |
| Sep-19 | 3 | 2.3 | 2.4 |
Average ordinary time hourly earnings as measured in the quarterly employment survey (QES) increased by 4.2 percent annually, while both the public and private sectors increased by 3.9 percent annually.
See Pay settlements help push wage growth to a ten-year high for more information on wages in the September 2019 quarter.
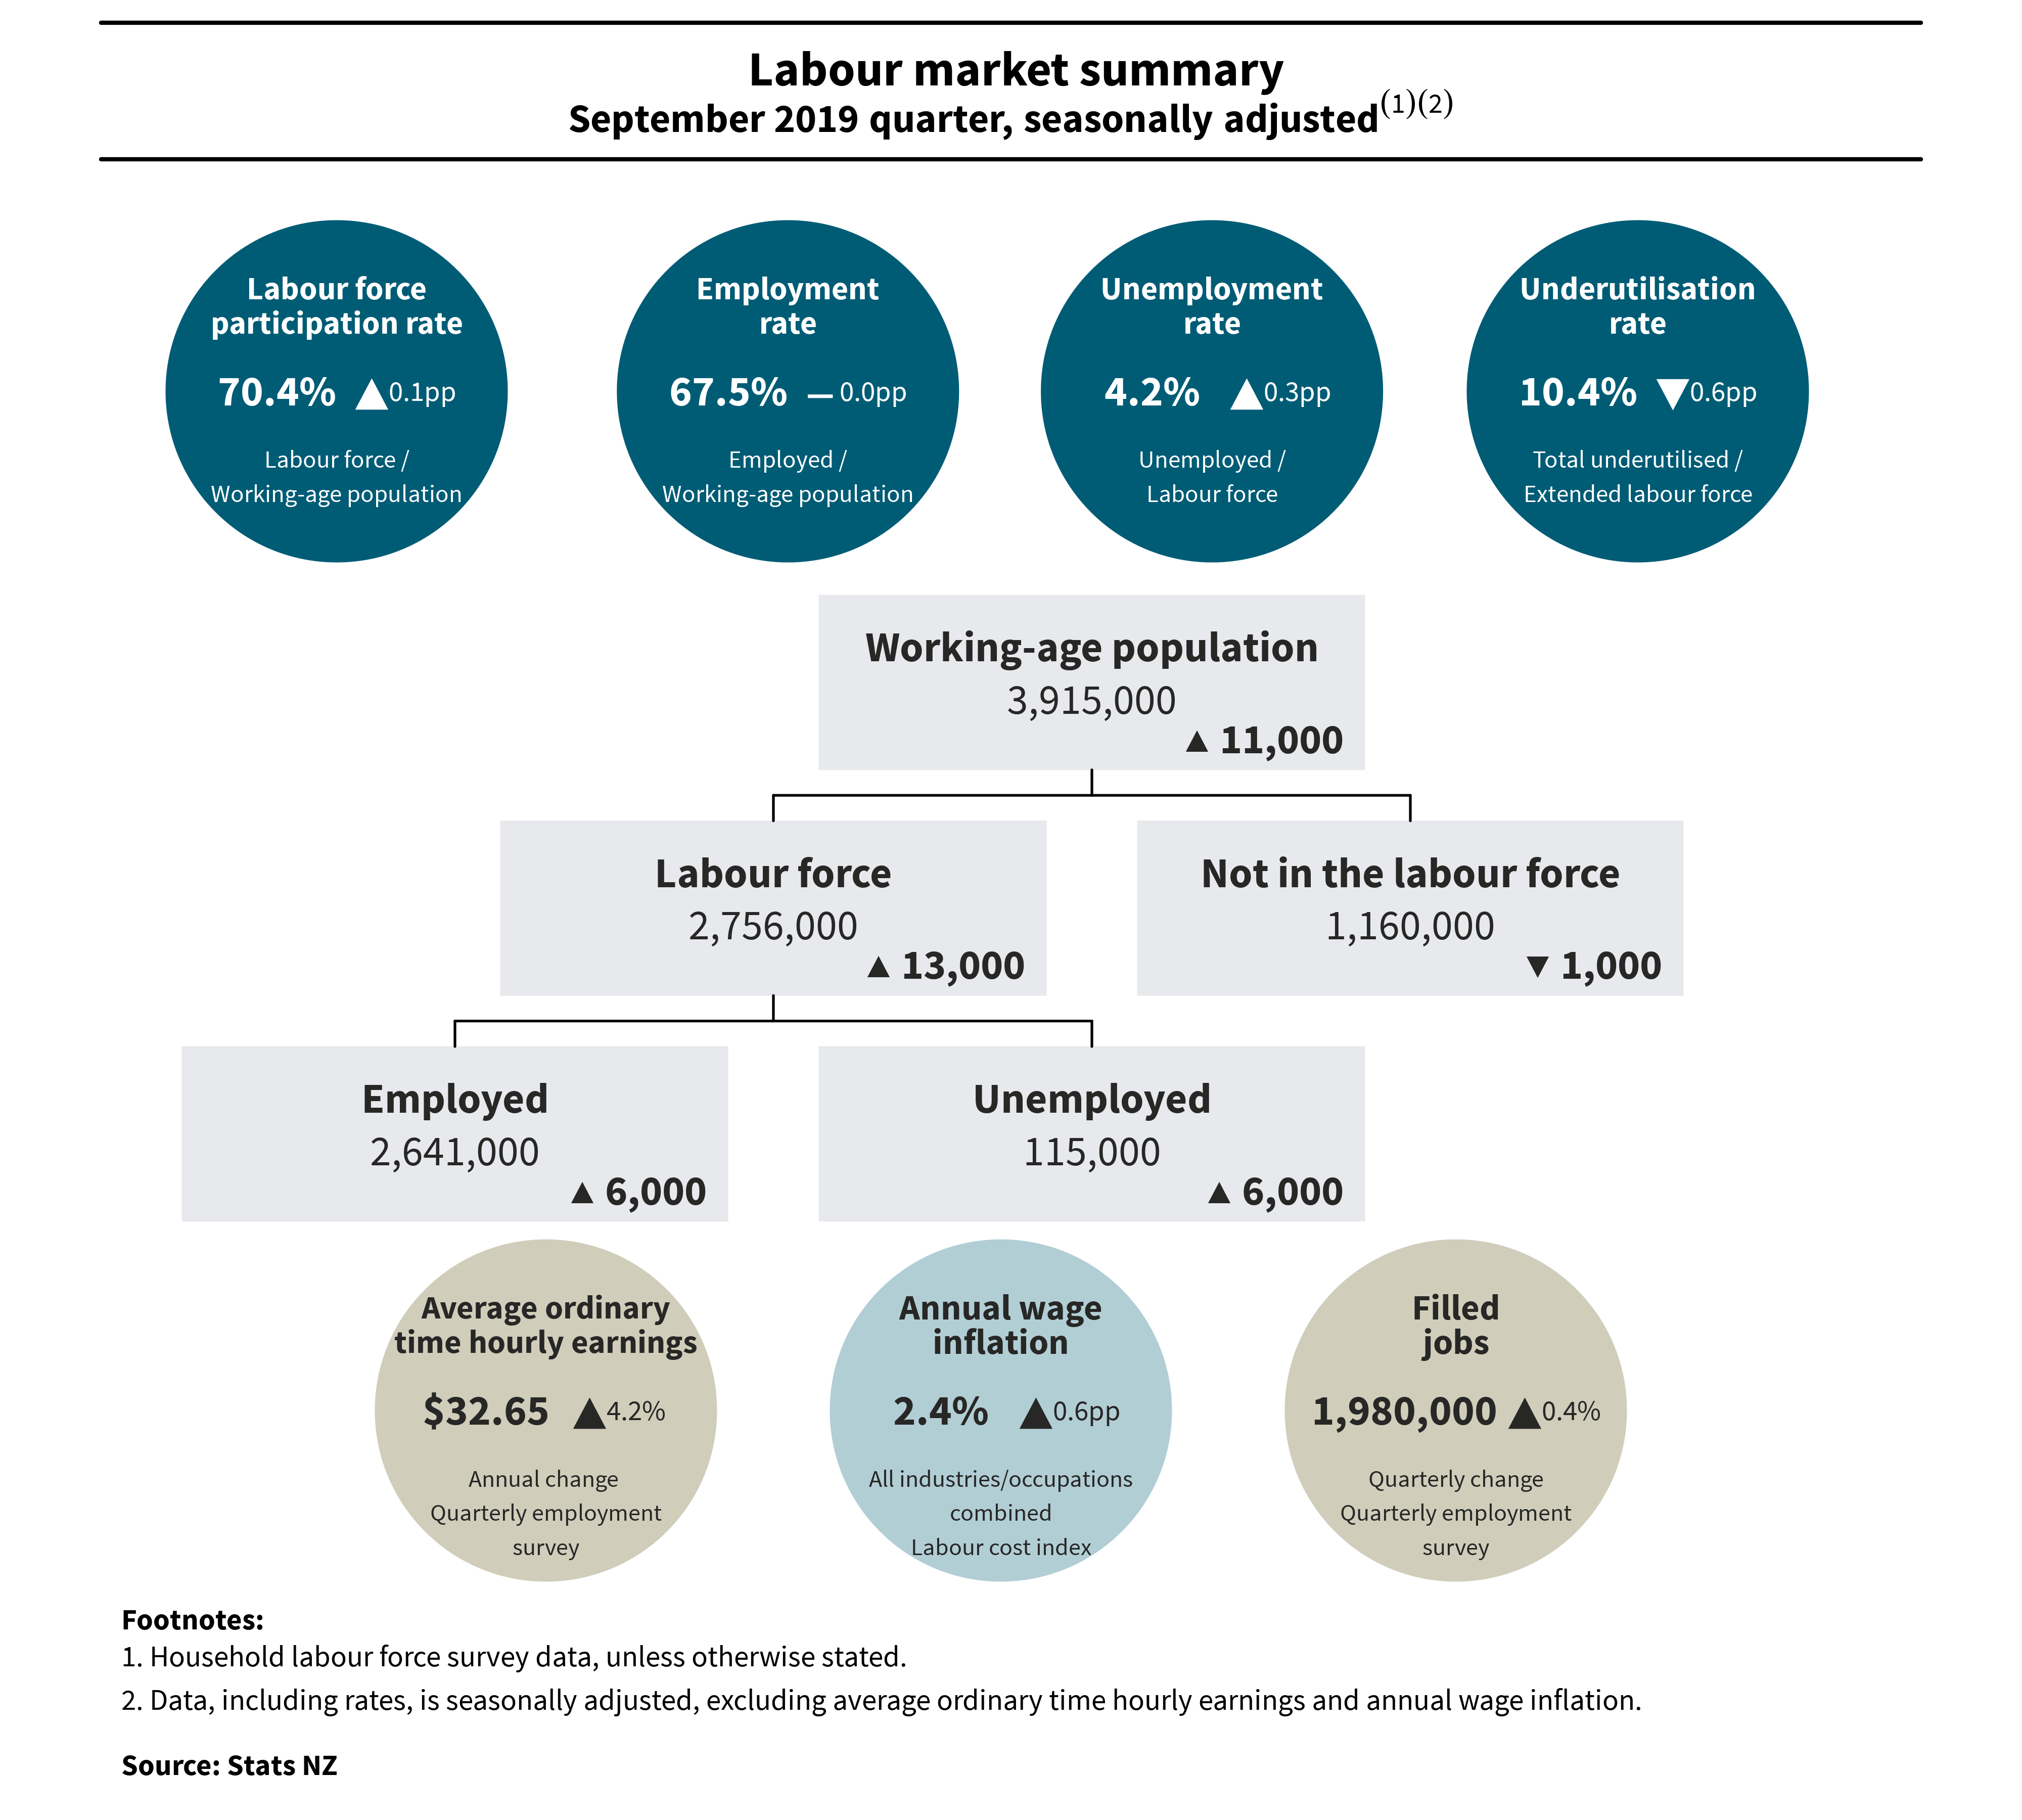
Text alternative for diagram, Labour market summary – September 2019 quarter, seasonally adjusted
Diagram shows data from September 2019 quarter’s household labour force survey (HLFS), quarterly employment survey (QES), and labour cost index (LCI), compared to the June 2019 quarter. HLFS results for the September 2019 quarter showed the labour force participation rate was 70.4%, up 0.1pp (percentage points). This rate is derived from labour force divided by working-age population. The employment rate was 67.5%, no change. This is derived from employed divided by working-age population. The unemployment rate was 4.2%, up 0.3pp. This is derived from unemployed divided by labour force. The underutilisation rate was 10.4%, down 0.6pp. This is derived from total underutilised divided by extended labour force. The working-age population was up 11,000 to 3,915,000. This is made up of the labour force, up 13,000 to 2,756,000, and people not in the labour force, down 1,000 to 1,160,000. The labour force is made up of employed people, up 6,000 to 2,641,000, and those unemployed, up 6,000 to 115,000. Average ordinary time hourly earnings from the QES were up 4.2% annually, to $32.65. Annual wage inflation from the LCI was up 0.6pp to 2.4%, for all industries and occupations combined. Filled jobs from the QES were up 0.4% for the quarter, to 1,980,000. Note: Household labour force survey data, unless otherwise stated. Data, including rates, is seasonally adjusted, excluding average ordinary time hourly earnings and annual wage inflation.
Text alternative for diagram, Underemployment summary – September 2019 quarter
Diagram shows the definition of underemployment and the relationship between underemployment and underutilisation, with data for September quarter 2019. Employed (2,632,000) made up of part time (less than 30 hours) (523,700) and full time (30 hours or more) (2,108,200). Part time made up of want more hours (109,600) and don’t want more hours (406,700). Want more hours made up of not available (21,300) and the three underemployed categories of available (87,200), unemployed (108,900), and potential labour force (84,300). The underemployed, unemployed and potential labour force combine to combine to total underutilisation (280,400). Note: Figures have been rounded to the nearest hundred. Due to rounding and respondents not supplying definite answers, individual figures may not sum to stated totals. None of the above values are seasonally adjusted, so may not match headline values.


