2023 Household Disability Survey Infographic

2023 Household Disability Survey shows a breakdown of key data from the 2023 Household Disability Survey. It includes disability rates, life experiences, and unmet needs.
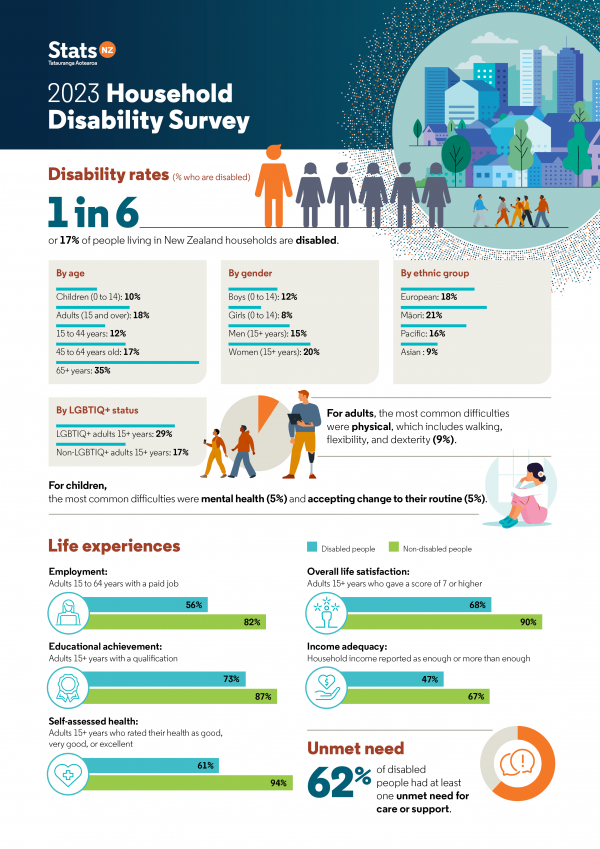
Infographic showing a breakdown of key data from the 2023 Household Disability Survey. Shows various graphs detailing disability rates, broken down by age, gender, ethnicity, and LGBTIQ+ status, and shares key statistics around life experiences for disabled people compared with non-disabled people. The infographic is divided into three sections.    First section is titled 'Disability rates (% who are disabled)'. The text says:    1 in 6, or 17%, of people living in New Zealand households are disabled.   Disability rates by age. Children (0 to14): 10%. Adults (15 and over): 18%; 15 to 44 years: 12%; 45 to 64 years: 17%; 65+ years: 35%.   Disability rates by gender. Boys (0 to14): 12%. Girls (0 to14): 8%. Men (15+ years): 15%. Women (15+ years): 20%.    Disability rates by ethnic group. European: 18%. Māori: 21%. Pacific: 16%. Asian: 9%.    Disability rates by LGBTIQ+ status. LGBTIQ+ adults 15+ years: 29%. Non-LGBTIQ+ adults 15+ years: 17%.    For adults, the most common difficulties were physical, which includes walking, flexibility, and dexterity (9%).    For children, the most common difficulties were mental health (5%) and accepting change to their routine (5%).    Second section is titled 'Life experiences'. The text says:    Employment. Disabled adults 15 to 64 years with a paid job: 56%. Non-disabled adults 15 to 64 years with a paid job: 82%.   Educational achievement. Disabled adults 15+ years with a qualification: 73%. Non-disabled adults with a qualification: 87%.    Self-assessed health. Disabled adults 15+ years who rated their health as good, very good, or excellent: 61%. Non-disabled adults 15+ years who rated their health as good, very good, or excellent: 94%.   Overall life satisfaction. Disabled adults 15+ years who gave a score of 7 or higher: 68%. Non-disabled adults 15+ years who gave a score of 7 or higher: 90%.    Income adequacy. Disabled people whose household income was reported as enough or more than enough: 47%. Non-disabled people whose household income was reported as enough or more than enough: 7%.   Third section is titled 'Unmet need'. The text says:    62% of disabled people had at least one unmet need for care or support.

Text description for infographic: 2023 Household Disability Survey

Infographic showing a breakdown of key data from the 2023 Household Disability Survey. Shows various graphs detailing disability rates, broken down by age, gender, ethnicity, and LGBTIQ+ status, and shares key statistics around life experiences for disabled people compared with non-disabled people. The infographic is divided into three sections: disability rates, life experiences, and unmet need.

Disability rates (% who are disabled)

1 in 6 (or 17%) of people living in New Zealand households are disabled.

By age

  • Children (0 to 14 years): 10%
  • Adults (15 and over): 18%
  • 15 to 44 years: 12%
  • 45 to 64 years: 17%
  • 65+ years: 35%

By gender

  • Boys (0 to 14 years): 12%
  • Girls (0 to 14 years): 8%
  • Men (15+ years): 15%
  • Women (15+ years): 20%

By ethnic group

  • European: 18%
  • Māori: 21%
  • Pacific: 16%
  • Asian: 9%

By LGBTIQ+ status

  • LGBTIQ+ adults (15+ years): 29%
  • Non-LGBTIQ+ adults (15+ years): 17%

Most common difficulties

  • For adults: The most common difficulties were physical, which includes walking, flexibility, and dexterity (9%).
  • For children: The most common difficulties were related to mental health (5%) and accepting change to their routine (5%).

Life experiences

(Comparisons between disabled and non-disabled people)

Employment

Adults 15 to 64 years with a paid job.

  • Disabled people: 56%
  • Non-disabled people: 82%

Educational achievement

Adults 15+ years with a qualification.

  • Disabled people: 73%
  • Non-disabled people: 87%

Self-assessed health

Adults 15+ years who rated their health as good, very good, or excellent.

  • Disabled people: 61%
  • Non-disabled people: 94%

Overall life satisfaction

Adults 15+ years who gave a score of 7 or higher.

  • Disabled people: 68%
  • Non-disabled people: 90%

Household income adequacy

Household income reported as enough or more than enough.

  • Disabled people: 47%
  • Non-disabled people: 67%

Unmet need

62% of disabled people had at least one unmet need for care or support.
/Stats NZ Public Release. View in full here.