Emerging evidence shows that exposure to two human-made air pollutants is associated with significant health impacts, Stats NZ said today.
The indicator Human health impacts of PM2.5 and NO2 reports on the health impacts associated with exposure to PM2.5 (fine particulate matter less than 2.5 micrometres in diameter) and NO2 (nitrogen dioxide) from human-made air pollution. It supersedes the previous health impacts indicator, Health impacts of PM10.
The new indicator:
- focuses on PM2.5 (particulate matter 2.5) and NO2 (nitrogen dioxide), the air pollutants now known to be of most concern in Aotearoa New Zealand
- expands the list of health impacts to cover estimated childhood asthma prevalence and hospitalisations associated with exposure to human-made NO2 air pollution
- shows the proportion of Aotearoa New Zealand’s population living in areas with poor air quality (based on exposure to concentrations of air pollutants above the World Health Organization (WHO) 2021 global guidelines)
- presents health impact data at the territorial authority and national levels.
The health impacts in the indicator were calculated using the HAPINZ (Health and Air Pollution in New Zealand) 3.0 model, published in July 2022, which uses base years of 2006 and 2016. When the HAPINZ study was commissioned in 2019, 2016 was the most recent year for which suitable population, health, and air quality data was available.
“Clean, healthy air is vital for human health and wellbeing,” environmental and agricultural statistics senior manager Michele Lloyd said.
“Even though Aotearoa New Zealand has good overall air quality relative to other countries, we now know that exposure to air pollutants, even at low levels, is associated with significant health impacts.”
Impacts on human health from human-made air pollution can include premature death, cardiovascular and respiratory hospitalisations, childhood asthma hospitalisations and asthma prevalence, and restricted activity days (days on which people cannot do the things they might otherwise have done if air pollution was not present).
The two human-made air pollutants of most concern, NO2 (mainly from vehicle emissions) and PM2.5 (mainly from combustion), were linked to an estimated 13,155 hospitalisations and an estimated 3,317 premature deaths in Aotearoa New Zealand in 2016.
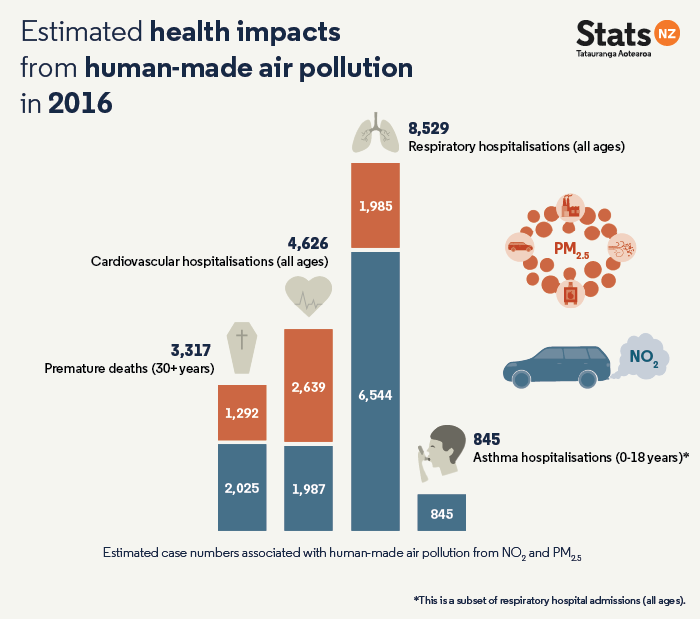
Text alternative for Estimated health impacts from human-made air pollution in 2016
Of the estimated hospitalisations (all ages) attributed to exposure to human-made air pollution in 2016:
- an estimated 71 percent (9,376 cases) were associated with motor vehicle emissions (mainly NO2 with some PM2.5)
- 26 percent (3,375 cases) were associated with PM2.5 emissions from domestic fires.
Of the estimated premature deaths (age 30+ years) attributed to exposure to human-made air pollution in 2016:
- an estimated 68 percent (2,247 cases) were associated with motor vehicle emissions (mainly NO2 with some PM2.5)
- 29 percent (962 cases) were associated with PM2.5 emissions from domestic fires.
The indicator shows that, from 2006 to 2016, the number of estimated health impacts from human-made air pollution increased, driven by an increasing population and increasing exposure to NO2 emissions. The increase in health impacts associated with NO2 exposure may reflect the increase in the number of diesel vehicles. From 2006 to 2016, estimated rates of premature deaths (per 100,000 people age 30+ years) and hospitalisations (per 100,000 people all ages) attributed to NO2 emissions increased by 12 percent and 23 percent respectively. In contrast, the estimated rates of premature deaths (per 100,000 people age 30+years) and hospitalisations (per 100, 000 people all ages) from PM2.5 exposure both decreased by 21 percent, most likely due to improvements made in domestic fire emissions.
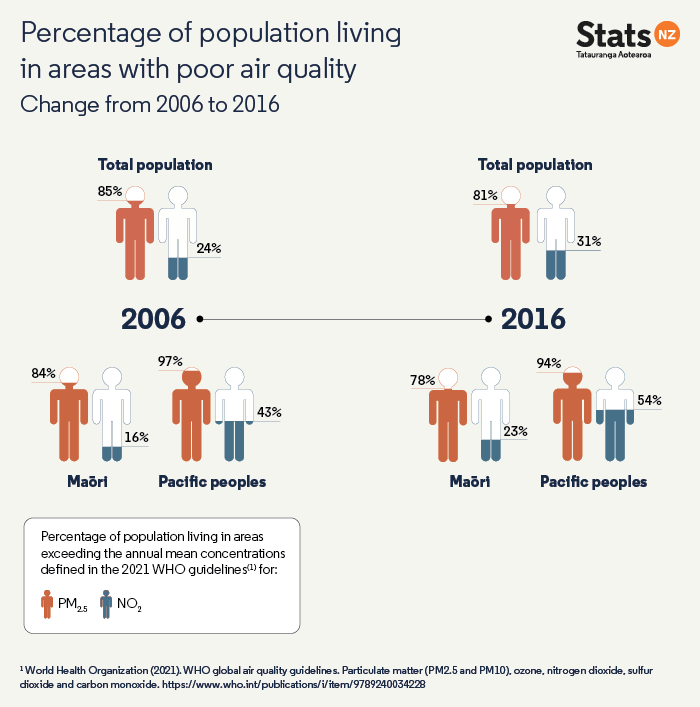
In both 2006 and 2016, much of Aotearoa New Zealand’s population was living in areas with poor air quality (defined as exposure to concentrations above the 2021 global guidelines published by the World Health Organization (WHO). There were persisting inequities for Pacific peoples, which may reflect differences in where people live as seen in these population density and diversity maps. From 2006 to 2016 the percentage of Aotearoa’s population living in areas where guidelines were exceeded:
- increased for NO2, from 24 percent to 31 percent, with higher rates for Pacific peoples (increased from 43 percent to 54 percent)
- decreased slightly for PM2.5, from 85 percent to 81 percent, with higher rates for Pacific peoples (decreased from 97 percent to 94 percent).
As might be expected, the estimated number of people who experienced health impacts from human-made PM2.5 and NO2 air pollution was highest in the cities with the biggest population sizes, Auckland and Christchurch City:
- Auckland – 939 premature deaths (age 30+ years) and 4,633 hospitalisations (all ages)
- Christchurch City – 462 premature deaths (age 30+ years) and 1,448 hospitalisations (all ages).
However, accounting for population size, territorial authorities in the lower South Island had higher rates of premature deaths from human-made air pollution, with Invercargill City having the highest rate in the country, with an estimated 219 premature deaths per 100,000 people age 30+ years. In comparison, Auckland had an estimated 104 premature deaths per 100,000 people age 30+ years.
Data for the Human health impacts of PM2.5 and NO2 was provided by HAPINZ 3.0, Waka Kotahi NZ Transport Agency, and Regional Councils.
Stats NZ publishes and updates environmental indicators on the pressures, state, and impacts of New Zealand’s environment including air, marine, fresh water, land, and atmosphere and climate, as part of a joint Environmental Reporting programme with partner Ministry for the Environment (MfE).
Human health impacts of PM2.5 and NO2 provides more information, including data and visualisations.
Text alternative for Estimated health impacts from human-made air pollution in 2016
This image shows data in a stacked bar graph that presents the estimated case numbers of premature deaths (30+ years), cardiovascular hospitalisations (all ages), respiratory hospitalisations (all ages) and asthma hospitalisations (0-18 years), from human-made air pollution, broken down by the pollutants PM2.5 and NO2, in 2016. There were 3,317 premature deaths (30+ years), 2,025 associated with NO2 and 1,292 associated with PM2.5. There were 4,626 cardiovascular hospitalisations (all ages), 1,987 associated with NO2 and 2,639 associated with PM2.5. There were 8,529 respiratory hospitalisations (all ages), 6,544 associated with NO2 and 1,985 associated with PM2.5. There were 845 asthma hospitalisations (0-18 years) associated with NO2. Asthma hospitalisations are a subset of respiratory hospitalisations (all ages).
Text alternative for Percentage of population living in areas with poor air quality – change from 2006 to 2016
This image shows data in a pictorial chart that presents the percentage of total, Maōri, and Pacific peoples populations living in areas exceeding the annual mean concentrations for PM2.5 and NO2 as defined in the 2021 WHO guidelines (World Health Organization, 2021) for 2006 and 2016. In 2006 85 percent of the total population was living in areas exceeding the annual mean concentration for PM2.5, and in 2016 this had decreased to 81 percent. In 2006 24 percent of the total population was living in areas exceeding the annual mean concentration for NO2, and in 2016 this had increased to 31 percent. In 2006 84 percent of the Māori population was living in areas exceeding the annual mean concentration for PM2.5, and in 2016 this had decreased to 78 percent. In 2006 16 percent of the Māori population was living in areas exceeding the annual mean concentration for NO2, and in 2016 this had increased to 23 percent. In 2006 97 percent of the Pacific peoples population was living in areas exceeding the annual mean concentration for PM2.5, and in 2016 this had decreased to 94 percent. In 2006 43 percent of the Pacific peoples population was living in areas exceeding the annual mean concentration for NO2, and in 2016 this had increased to 54 percent. The reference is to the WHO global air quality guidelines 2021, Particulate matter (PM2.5 and PM10), ozone, nitrogen dioxide, sulfur dioxide and carbon monoxide. Available at https://www.who.int/publications/i/item/9789240034228.


