There was a net migration loss of 28,500 people from New Zealand to Australia in the December 2025 year, according to provisional estimates released by Stats NZ today.
“The net migration loss from New Zealand to Australia in 2025 was smaller than the loss of 31,100 in 2024,” international migration statistics spokesperson Dave O’Donovan said.
Traditionally, there has been a net migration loss from New Zealand to Australia. This averaged about 30,000 a year during 2004 to 2013, and 3,000 a year during 2014 to 2019.
The record annual net migration loss from New Zealand to Australia was 43,700 in the March 2012 year.
“The smaller net migration loss in 2025 was due to slightly more arrivals from Australia to New Zealand, while departures from New Zealand to Australia were similar in number,” O’Donovan said.
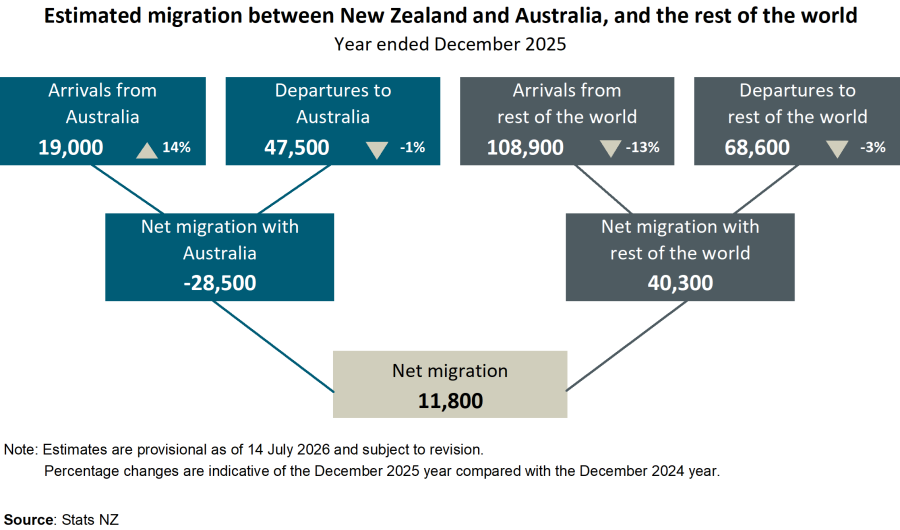
The net migration loss in 2025 was made up of 47,500 migrant departures to Australia and 19,000 migrant arrivals from Australia. This compared with 47,800 migrant departures to Australia and 16,800 migrant arrivals from Australia in 2024.
The annual record for migrant departures from New Zealand to Australia was 62,800 in the June 2012 year.
| Year ended | “Migrant arrivals (from AU to NZ | “Migrant departures (from NZ to AU | Net migration (from NZ to AU) |
| Sep-2004 | estimated from Stats NZ data)” | estimated from ABS data)” | 21667 |
| Dec-2004 | 20911 | 42578 | 19837 |
| Mar-2005 | 20243 | 40080 | 20889 |
| Jun-2005 | 19633 | 40522 | 22757 |
| Sep-2005 | 19165 | 41922 | 23925 |
| Dec-2005 | 18894 | 42819 | 24881 |
| Mar-2006 | 18664 | 43545 | 24808 |
| Jun-2006 | 18497 | 43305 | 25235 |
| Sep-2006 | 18299 | 43534 | 25980 |
| Dec-2006 | 18408 | 44388 | 27135 |
| Mar-2007 | 18558 | 45693 | 29032 |
| Jun-2007 | 18610 | 47642 | 31158 |
| Sep-2007 | 18737 | 49895 | 32272 |
| Dec-2007 | 18713 | 50985 | 33936 |
| Mar-2008 | 18538 | 52474 | 36130 |
| Jun-2008 | 18302 | 54432 | 37659 |
| Sep-2008 | 18114 | 55773 | 39504 |
| Dec-2008 | 17881 | 57385 | 39948 |
| Mar-2009 | 17985 | 57933 | 37505 |
| Jun-2009 | 18185 | 55690 | 32224 |
| Sep-2009 | 18745 | 50969 | 26788 |
| Dec-2009 | 19484 | 46272 | 22337 |
| Mar-2010 | 20149 | 42486 | 20570 |
| Jun-2010 | 20711 | 41281 | 21933 |
| Sep-2010 | 20973 | 42906 | 24898 |
| Dec-2010 | 21074 | 45972 | 28384 |
| Mar-2011 | 20809 | 49193 | 33172 |
| Jun-2011 | 20547 | 53719 | 37655 |
| Sep-2011 | 19916 | 57571 | 40690 |
| Dec-2011 | 19385 | 60075 | 42699 |
| Mar-2012 | 19131 | 61830 | 43747 |
| Jun-2012 | 18941 | 62688 | 43743 |
| Sep-2012 | 19089 | 62832 | 42885 |
| Dec-2012 | 19694 | 62579 | 40851 |
| Mar-2013 | 20934 | 61785 | 36955 |
| Jun-2013 | 22201 | 59156 | 31657 |
| Sep-2013 | 23700 | 55357 | 25591 |
| Dec-2013 | 25568 | 51159 | 19347 |
| Mar-2014 | 27615 | 46962 | 13144 |
| Jun-2014 | 29089 | 42233 | 9009 |
| Sep-2014 | 29956 | 38965 | 6368 |
| Dec-2014 | 30557 | 36925 | 3959 |
| Mar-2015 | 31368 | 35327 | 2603 |
| Jun-2015 | 31816 | 34419 | 1575 |
| Sep-2015 | 32282 | 33857 | 889 |
| Dec-2015 | 32682 | 33571 | 698 |
| Mar-2016 | 33020 | 33718 | 972 |
| Jun-2016 | 33467 | 34439 | 2590 |
| Sep-2016 | 33235 | 35825 | 4129 |
| Dec-2016 | 32910 | 37039 | 4600 |
| Mar-2017 | 32481 | 37081 | 4197 |
| Jun-2017 | 31695 | 35892 | 3120 |
| Sep-2017 | 31339 | 34459 | 2662 |
| Dec-2017 | 30574 | 33236 | 2797 |
| Mar-2018 | 29595 | 32392 | 3236 |
| Jun-2018 | 28827 | 32063 | 3630 |
| Sep-2018 | 28215 | 31845 | 3747 |
| Dec-2018 | 28002 | 31749 | 4352 |
| Mar-2019 | 27366 | 31718 | 4437 |
| Jun-2019 | 27178 | 31615 | 4230 |
| Sep-2019 | 27617 | 31847 | 3639 |
| Dec-2019 | 28509 | 32148 | 2680 |
| Mar-2020 | 30704 | 33384 | -675 |
| Jun-2020 | 32772 | 32097 | -3313 |
| Sep-2020 | 28605 | 25292 | -8082 |
| Dec-2020 | 26705 | 18623 | -7340 |
| Mar-2021 | 21222 | 13882 | -3671 |
| Jun-2021 | 16608 | 12937 | -1379 |
| Sep-2021 | 21685 | 20306 | 3856 |
| Dec-2021 | 18715 | 22571 | 5387 |
| Mar-2022 | 16656 | 22043 | 5907 |
| Jun-2022 | 16967 | 22874 | 7697 |
| Sep-2022 | 15617 | 23314 | 11009 |
| Dec-2022 | 17861 | 28870 | 14618 |
| Mar-2023 | 20211 | 34829 | 19364 |
| Jun-2023 | 20188 | 39552 | 23826 |
| Sep-2023 | 17881 | 41707 | 26705 |
| Dec-2023 | 16812 | 43517 | 29970 |
| Mar-2024 | 15995 | 45965 | 32086 |
| Jun-2024 | 15577 | 47663 | 32094 |
| Sep-2024 | 15675 | 47769 | 31769 |
| Dec-2024 | 15973 | 47742 | 31053 |
| Mar-2025 | 16761 | 47814 | 31006 |
| Jun-2025 | 17230 | 48236 | 30297 |
| Sep-2025 | 17853 | 48150 | 29710 |
| Dec-2025 | 18501 | 48211 | 28478 |
These estimates use data from Stats NZ and the Australian Bureau of Statistics (ABS, whose data is currently available up to December 2025).
New Zealand citizens drive trans-Tasman migration
New Zealand citizens were the main driver of trans-Tasman migration flows in 2025, reflecting a long-standing historical pattern.
In 2025, New Zealand citizens – people travelling on New Zealand passports – made up 86 percent of the 47,500 migrant departures to Australia, and 68 percent of the 19,000 migrant arrivals from Australia. In 2024, these proportions were 85 percent and 67 percent, respectively.
Australia the main destination for New Zealand-citizen migrants
Of the 64,200 migrant departures of New Zealand citizens to all countries in 2025, 64 percent were to Australia. Based on available data from 1979, this share has fluctuated between 41 percent in 1991 and 77 percent in 2012.
| Year ended December | NZ-citizen migrant departures from NZ to RoW | NZ-citizen migrant departures from NZ to AU |
| 1979 | 24459 | 39613 |
| 1980 | 19792 | 33556 |
| 1981 | 15477 | 33475 |
| 1982 | 13646 | 23942 |
| 1983 | 12845 | 12096 |
| 1984 | 14630 | 15701 |
| 1985 | 16742 | 27152 |
| 1986 | 18043 | 32050 |
| 1987 | 17925 | 31094 |
| 1988 | 17418 | 40599 |
| 1989 | 19106 | 30564 |
| 1990 | 18981 | 16978 |
| 1991 | 17808 | 12795 |
| 1992 | 17228 | 13580 |
| 1993 | 17222 | 13218 |
| 1994 | 17579 | 16429 |
| 1995 | 18734 | 18684 |
| 1996 | 20442 | 20301 |
| 1997 | 21751 | 22522 |
| 1998 | 23023 | 25250 |
| 1999 | 22969 | 30246 |
| 2000 | 23789 | 34891 |
| 2001 | 23503 | 32528 |
| 2002 | 20093 | 22019 |
| 2003 | 17481 | 21378 |
| 2004 | 18054 | 32942 |
| 2005 | 19237 | 35415 |
| 2006 | 19980 | 37363 |
| 2007 | 20959 | 44329 |
| 2008 | 18697 | 49434 |
| 2009 | 14483 | 34308 |
| 2010 | 16086 | 40892 |
| 2011 | 17216 | 53971 |
| 2012 | 16219 | 54478 |
| 2013 | 15178 | 40504 |
| 2014 | 15447 | 29613 |
| 2015 | 15998 | 27338 |
| 2016 | 11479 | 29848 |
| 2017 | 16593 | 24925 |
| 2018 | 17673 | 24729 |
| 2019 | 13689 | 24406 |
| 2020 | 6123 | 9211 |
| 2021 | 10399 | 15979 |
| 2022 | 24160 | 27876 |
| 2023 | 27234 | 38398 |
| 2024 | 26771 | 40581 |
| 2025 | 23103 | 41083 |
The annual record for migrant departures of New Zealand citizens to all countries was 72,400 in the February 2012 year.
Overseas-born New Zealand citizens migrating to Australia
Since the early 2000s, people who were born outside New Zealand have made up a growing proportion of New Zealand citizens migrating to Australia.
Of New Zealand citizens who migrated to Australia in 2025, 35 percent were born outside New Zealand. This compares with an average of 22 percent in 2004 to 2011, and 33 percent in 2016 to 2019.
This is higher than the overseas-born proportion of New Zealand’s population, which increased from 19.5 percent in 2001 to 28.8 percent in 2023 – see ‘Almost 30 percent of usual residents born overseas’ in 2023 Census population, dwelling, and housing highlights.
Among New Zealand’s population aged 20 to 39 years in 2023, 37 percent were born overseas.
Migrants are generally concentrated in the young-adult ages. Of the 64,200 migrant departures of New Zealand citizens to all countries in 2025, 50 percent were aged 20 to 39 years.
Migration to Australia via New Zealand (published in June 2017) has historical context relating to this release.
Net migration gain from the rest of the world
There was a provisional net migration gain of 40,300 to New Zealand from the rest of the world (excluding Australia) in 2025. This was down on the net gain of 54,800 in 2024. The record for a calendar year was a net gain of 156,200 in 2023.
“The net migration gain from the rest of the world in 2025 more than offset the net migration loss of 28,500 to Australia,” O’Donovan said.
Data on the destination of migrants departing New Zealand is only available for Australia.
In the 21 years from 2004 to 2024, net migration gains from the rest of the world averaged 48,000 a year.
| Year ended | Migration from RoW (excluding AU) to NZ | Migration from NZ to RoW (excluding AU) | Net migration from RoW (excluding AU) to NZ |
| Sep-2004 | 84680 | 44431 | 40249 |
| Dec-2004 | 83253 | 49276 | 33977 |
| Mar-2005 | 82771 | 50900 | 31871 |
| Jun-2005 | 84474 | 50618 | 33856 |
| Sep-2005 | 85106 | 50665 | 34441 |
| Dec-2005 | 85318 | 49171 | 36147 |
| Mar-2006 | 86678 | 48091 | 38587 |
| Jun-2006 | 87099 | 48393 | 38706 |
| Sep-2006 | 89524 | 48236 | 41288 |
| Dec-2006 | 92129 | 48281 | 43848 |
| Mar-2007 | 93866 | 48953 | 44913 |
| Jun-2007 | 94795 | 49118 | 45677 |
| Sep-2007 | 95351 | 49800 | 45551 |
| Dec-2007 | 94912 | 49939 | 44973 |
| Mar-2008 | 96515 | 49818 | 46697 |
| Jun-2008 | 99545 | 49846 | 49699 |
| Sep-2008 | 101405 | 49498 | 51907 |
| Dec-2008 | 102009 | 49790 | 52219 |
| Mar-2009 | 101177 | 49629 | 51548 |
| Jun-2009 | 96978 | 48486 | 48492 |
| Sep-2009 | 92871 | 48177 | 44694 |
| Dec-2009 | 88116 | 47510 | 40606 |
| Mar-2010 | 83539 | 48337 | 35202 |
| Jun-2010 | 80783 | 49881 | 30902 |
| Sep-2010 | 80057 | 50479 | 29578 |
| Dec-2010 | 79690 | 51583 | 28107 |
| Mar-2011 | 80155 | 52466 | 27689 |
| Jun-2011 | 80969 | 52718 | 28251 |
| Sep-2011 | 81654 | 53584 | 28070 |
| Dec-2011 | 81075 | 54520 | 26555 |
| Mar-2012 | 81780 | 53717 | 28063 |
| Jun-2012 | 81645 | 52885 | 28760 |
| Sep-2012 | 80340 | 51646 | 28694 |
| Dec-2012 | 80828 | 50385 | 30443 |
| Mar-2013 | 80003 | 48859 | 31144 |
| Jun-2013 | 80668 | 48202 | 32466 |
| Sep-2013 | 81271 | 47563 | 33708 |
| Dec-2013 | 82667 | 46029 | 36638 |
| Mar-2014 | 85557 | 45628 | 39929 |
| Jun-2014 | 88318 | 45847 | 42471 |
| Sep-2014 | 94224 | 45587 | 48637 |
| Dec-2014 | 96812 | 45440 | 51372 |
| Mar-2015 | 100224 | 46355 | 53869 |
| Jun-2015 | 101635 | 46633 | 55002 |
| Sep-2015 | 104104 | 46718 | 57386 |
| Dec-2015 | 107105 | 46598 | 60507 |
| Mar-2016 | 109310 | 45183 | 64127 |
| Jun-2016 | 110947 | 43744 | 67203 |
| Sep-2016 | 110627 | 42622 | 68005 |
| Dec-2016 | 110643 | 43154 | 67489 |
| Mar-2017 | 110893 | 45347 | 65546 |
| Jun-2017 | 110918 | 48265 | 62653 |
| Sep-2017 | 110995 | 51797 | 59198 |
| Dec-2017 | 110507 | 54430 | 56077 |
| Mar-2018 | 110176 | 56008 | 54168 |
| Jun-2018 | 109840 | 57215 | 52625 |
| Sep-2018 | 111002 | 57827 | 53175 |
| Dec-2018 | 111648 | 57729 | 53919 |
| Mar-2019 | 111857 | 57736 | 54121 |
| Jun-2019 | 113900 | 57569 | 56331 |
| Sep-2019 | 119387 | 56621 | 62766 |
| Dec-2019 | 135038 | 59770 | 75268 |
| Mar-2020 | 152112 | 61107 | 91005 |
| Jun-2020 | 131092 | 49569 | 81523 |
| Sep-2020 | 104188 | 47289 | 56899 |
| Dec-2020 | 70222 | 40718 | 29504 |
| Mar-2021 | 32581 | 38034 | -5453 |
| Jun-2021 | 38243 | 46207 | -7964 |
| Sep-2021 | 38569 | 45534 | -6965 |
| Dec-2021 | 38803 | 48366 | -9563 |
| Mar-2022 | 37204 | 50755 | -13551 |
| Jun-2022 | 45708 | 55703 | -9995 |
| Sep-2022 | 66056 | 60212 | 5844 |
| Dec-2022 | 99180 | 59688 | 39492 |
| Mar-2023 | 149923 | 57874 | 92049 |
| Jun-2023 | 187337 | 56894 | 130443 |
| Sep-2023 | 212724 | 55085 | 157639 |
| Dec-2023 | 212006 | 55840 | 156166 |
| Mar-2024 | 191314 | 59209 | 132105 |
| Jun-2024 | 165318 | 63013 | 102305 |
| Sep-2024 | 141075 | 67074 | 74001 |
| Dec-2024 | 125669 | 70869 | 54800 |
| Mar-2025 | 116973 | 72243 | 44730 |
| Jun-2025 | 111424 | 70655 | 40769 |
| Sep-2025 | 109486 | 69393 | 40093 |
| Dec-2025 | 108898 | 68636 | 40262 |
Changes in migration are typically due to a combination of factors. These include relative economic and labour market conditions between New Zealand and the rest of the world, and immigration policy in New Zealand and other countries.
A migrant is someone changing their country of residence, irrespective of their citizenship or visa type. Migrants include both New Zealand and non-New Zealand citizens, as both affect the population living in New Zealand. A 12-month threshold is generally used internationally to differentiate migrants from short-term travellers .
The latest monthly International migration release contains the most recent Stats NZ migration estimates, including revisions to previous estimates.
Text alternative for diagram Estimated migration between New Zealand and Australia, and the rest of the world, year ended December 2025
Diagram shows estimates of migration between New Zealand and Australia, and New Zealand and the rest of the world for the year ended December 2025. Overall, net migration is 11,800, made up of a net loss with Australia of 28,500 (based on 19,000 migrant arrivals, a 14 percent increase on 2024, and 47,500 migrant departures, a 1 percent decrease) and a net gain of 40,300 with the rest of the world (excluding Australia) (based on 108,900 migrant arrivals, a 13 percent decrease on 2024, and 68,600 migrant departures, a 3 percent decrease). All estimates are provisional as of 14 July 2026, and include adjustments for non-response to country of last permanent residence. Source: Stats NZ.