
Key points:
- Fertiliser cost and fertiliser profitability are different. Fertiliser cost is obvious; fertiliser profitability is rarely assessed.
- Fertiliser response curves are needed to calculate fertiliser profitability.
- More efficient fertiliser use results in more profit and a lower carbon intensity of grain.
With fertiliser prices climbing, many growers are taking a hard look at their fertiliser expenditure. There is a lot of discussion about tightening margins and cutting rates, yet little focus on the core issue of fertiliser profitability. Given how much is spent on fertiliser each year, it makes sense to know if this annual investment is cash flow positive.
In budgets and profit and loss (P&L) statements, fertiliser is typically the biggest cost, yet its return on investment (ROI) is rarely measured. Metrics for fertiliser profitability are rarely called upon when gauging cropping profitability. A profitable operation does not necessarily mean fertiliser applications are also profitable. Inefficient and unprofitable fertiliser use can be concealed by good seasonal conditions, management, and grain prices.
Cutting budgeted fertiliser expenditure when fertiliser prices increase, with no consequential change to budgeted revenue, highlights a need for a closer look at fertiliser profitability. It requires a focus on how effective each unit of fertiliser is, rather than on the total fertiliser cost.
Gauging fertiliser profitability
Assessing fertiliser profitability needs yield response data for each incremental unit of fertiliser. This comes from a fertiliser response curve, generated from at least four fertiliser rates including a nil rate. When a crop is responsive to fertiliser, there are diminishing marginal returns as fertiliser rate increases. The first dollar invested gives the biggest ROI then ROI gradually diminishes until there is not enough justification to invest more.
Many growers aim for a 100% return on their fertiliser investment – spending $1 to get $2 back, making $1 margin or profit for $1 cost. In Figure 1, if the aim is at least 100% ROI, investing less than 24 kg/ha would mean yield and margin increases are not realised. Applying more than 24 kg/ha means a lower ROI compared to investing it elsewhere.
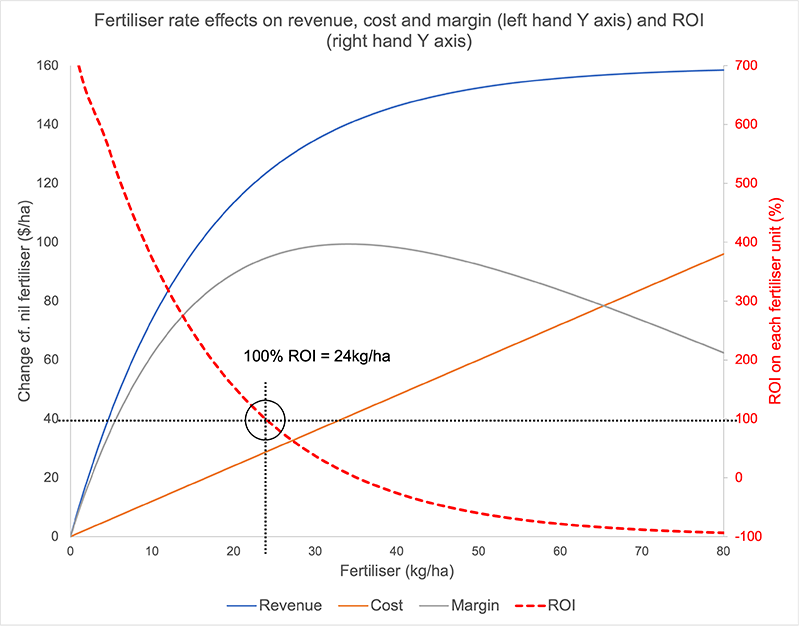
While such precise application of fertiliser rates is impossible in practice, an understanding of fertiliser responsiveness can shift practical rates to substantially improve returns. For instance, in Figure 1:
- applying 20 – 30 kg/ha would be a good result.
- applying an extra 10 kg/ha (30 – 40 kg/ha) would represent additional cost and a poor rate of return on it.
- using 70 kg/ha to get close to maximising yield would mean outlaying an extra $48/ha (compared to using 30 kg/ha), a $25/ha reduction in margin and negative rates of return on each kg applied from 35 to 70 kg/ha.
Sometimes fertiliser profitability is roughly gauged by looking at yields from a higher fertiliser rate strip in a paddock. If the yield in the strip is the same as that around it, the fertiliser rate in the paddock is too high, but we don’t know by how much.
If there is more yield in the higher rate strip, the paddock rate is insufficient. But again, we don’t know by how much. A basic economic analysis (revenue – cost) that ignores diminishing returns cannot determine the optimum fertiliser rate and can make the whole step up in fertiliser rate appear more profitable than it is.
Comparing response curves
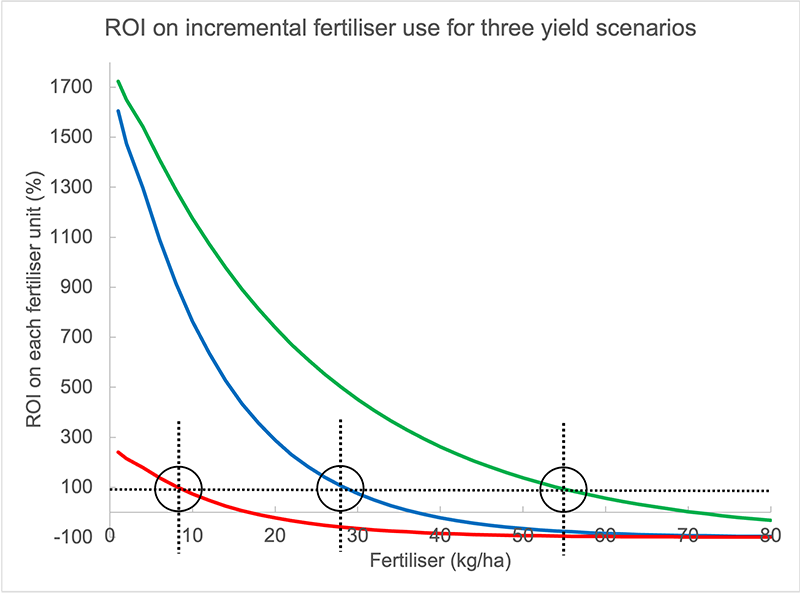
Fertiliser response and ROI curves are used to gauge the fertiliser rate that corresponds with the minimum acceptable ROI for your situation. Figure 2 presents three scenarios with the same maximum yield but different response curves. The green scenario responds to most fertiliser; 100% ROI is at 54 kg/ha. In the blue scenario, 100% ROI is at 28 kg/ha. The red scenario is largely unresponsive; 100% ROI is 8 kg/ha and fertiliser is unprofitable above 16 kg/ha.
ROI on total fertiliser spend vs incremental fertiliser spend
The following data from a WA nitrogen (N) trial compares two ways of assessing fertiliser ROI. The first is the ROI on each incremental unit of N (as used in Figures 1 and 2 above). The second is the ROI of the total spend at each N rate, calculated as:
ROI at each nitrogen rate = margin change compared to nil x 100
total nitrogen cost
Using this method, every N rate appears profitable (Table 1, final column). But when the profitability of each incremental N rate is examined, only 25 kg/ha and 50 kg/ha are profitable. Using the incremental ROI curve in Figure 3, fertiliser reaches break-even at 65 kg/ha.
Table 1. Comparison of incremental ROI% and total spend ROI% at four N rates.
N rate (kg/ha) | N cost increase cf. nil ($/ha) | Revenue increase cf. nil ($/ha) | Margin change cf. nil ($/ha) | ROI% incremental | ROI% total spend |
25 | 50 | 337 | 287 | 321 | 574 |
50 | 100 | 473 | 373 | 70 | 373 |
75 | 150 | 528 | 378 | -31 | 252 |
100 | 200 | 550 | 350 | -72 | 175 |

Guide to likely fertiliser profitability
Advice
Like farmers, most advisers have enough experience to have some gut feel for where fertiliser rates can go up or down.
If your adviser is telling you to apply fertiliser for maintenance, replacement, insurance or the longer term, there is a good chance they think your fertiliser investment will not be cash flow positive this year.
Soil test
Soil tests are useful to gauge paddock nutrient stocks and potential nutrient deficits. They aren’t always accurate at predicting if the sampled site is responsive to fertiliser and are difficult to extrapolate beyond the sampled site. Fertiliser rates derived from soil tests are probably a guide at best. Some soil test advisory systems have nutrient response curves built into them which illustrate diminishing returns and can help assess the riskiness of higher rates.
Adjust fertiliser rates
Ranking how responsive your paddocks, and even parts of paddocks, are to fertiliser (based on factors like soil type, production capacity, soil test results) is a good starting point for adjusting rates. Start with a basic ranking system such as:
- very responsive (less risky to keep fertiliser rates high)
- moderately responsive (fertiliser investments somewhat risky)
- non-responsive (use nil or lower rate of fertiliser)
remembering that fertiliser responsiveness of a paddock is not the same as its grain productiveness. If you cannot rate your paddocks for fertiliser responsiveness and profitability, it is an indicator you need to start measuring and critically thinking about fertiliser responsiveness.
Measure and calculate it yourself
Using the variable rate application capacity of your machinery, apply at least four fertiliser rates, including a nil, and yield map the results. Generate a response curve from the results and calculate the incremental ROI. With a few years of data you will be able to gauge whether there is no response to fertiliser, big responses, or somewhere in the middle. You will also have your own metrics around the riskiness of your fertiliser investments across a range of seasons.
Lower carbon emissions through better fertiliser use
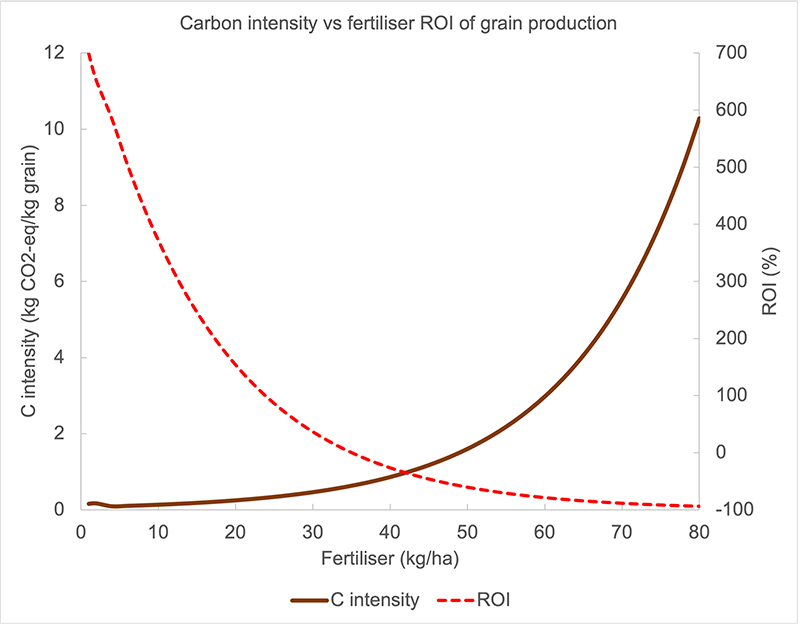
While profitable fertiliser use is the objective of most farmers, achieving it also has positive environmental effects. Fertiliser, especially nitrogen fertiliser, is a big contributor to the overall emissions from grain production. High fertiliser rates that produce small amounts of grain per unit of fertiliser have an unnecessarily high carbon footprint.
Figure 4 shows the ROI and carbon intensity of incremental units of fertiliser. Carbon intensity is the amount of carbon required to produce one kilogram of grain. As ROI on fertiliser use decreases, carbon intensity increases. Each unit of fertiliser has the same carbon cost. When less grain is produced as fertiliser rates increase, the overall carbon intensity of the grain increases. Using the economic optimal amount of fertiliser reduces the carbon intensity of grain. Or put another way, doing the right thing by your pocket also does the right thing by the environment.
Tips for growers
- When testing for responsiveness, ensure that there are four fertiliser rates, including a nil rate.
- If you aren’t comfortable doing this yourself, find an adviser who will help you measure fertiliser responsiveness in your paddocks.
- An adviser can help take your fertiliser responsiveness results and interpret them from a financial point of view.


