Seasonally adjusted unemployment reached 3.2 percent in the December 2021 quarter while the underutilisation rate stayed at 9.2 percent, Stats NZ said today.
The unemployment rate remained low in the last quarter of 2021, down to 3.2 percent, from 3.3 percent (revised) the previous quarter, while the underutilisation rate did not change at 9.2 percent.
“The labour market continued to show the tightness we saw in the September 2021 quarter, with both unemployment and underutilisation rates remaining low,” work and wellbeing statistics senior manager Becky Collett said.
| Quarter | Men | Women | Total |
| Dec-07 | 3.3 | 3.4 | 3.4 |
| Mar-08 | 3.6 | 4 | 3.8 |
| Jun-08 | 3.8 | 3.8 | 3.8 |
| Sep-08 | 4.1 | 4 | 4.1 |
| Dec-08 | 4.3 | 4.6 | 4.4 |
| Mar-09 | 5.1 | 4.9 | 5 |
| Jun-09 | 5.6 | 6 | 5.8 |
| Sep-09 | 6.3 | 6 | 6.2 |
| Dec-09 | 6.6 | 6.5 | 6.6 |
| Mar-10 | 5.6 | 6.3 | 5.9 |
| Jun-10 | 6.7 | 6.5 | 6.6 |
| Sep-10 | 5.6 | 6.6 | 6.1 |
| Dec-10 | 6 | 6.5 | 6.2 |
| Mar-11 | 5.7 | 6.4 | 6 |
| Jun-11 | 6 | 6.1 | 6.1 |
| Sep-11 | 5.6 | 6.3 | 6 |
| Dec-11 | 6.1 | 6 | 6.1 |
| Mar-12 | 6.1 | 6.7 | 6.4 |
| Jun-12 | 6.2 | 6.7 | 6.4 |
| Sep-12 | 6.6 | 6.9 | 6.7 |
| Dec-12 | 6 | 6.7 | 6.3 |
| Mar-13 | 5.2 | 6.5 | 5.8 |
| Jun-13 | 5.5 | 6.5 | 6 |
| Sep-13 | 5.5 | 6.2 | 5.8 |
| Dec-13 | 5 | 6.4 | 5.7 |
| Mar-14 | 5.1 | 6.1 | 5.6 |
| Jun-14 | 4.6 | 6 | 5.3 |
| Sep-14 | 4.6 | 6.1 | 5.3 |
| Dec-14 | 4.8 | 6.3 | 5.5 |
| Mar-15 | 5.1 | 5.9 | 5.5 |
| Jun-15 | 4.8 | 6.3 | 5.5 |
| Sep-15 | 5.3 | 6.1 | 5.7 |
| Dec-15 | 4.7 | 5.3 | 5 |
| Mar-16 | 5 | 5.6 | 5.3 |
| Jun-16 | 4.7 | 5.5 | 5.1 |
| Sep-16 | 4.7 | 5.3 | 5 |
| Dec-16 | 4.8 | 5.8 | 5.3 |
| Mar-17 | 4.3 | 5.6 | 4.9 |
| Jun-17 | 4.7 | 4.9 | 4.8 |
| Sep-17 | 4.1 | 5.4 | 4.7 |
| Dec-17 | 4 | 5 | 4.5 |
| Mar-18 | 3.9 | 4.8 | 4.4 |
| Jun-18 | 4.3 | 4.8 | 4.5 |
| Sep-18 | 4 | 4 | 4 |
| Dec-18 | 4.5 | 4.2 | 4.3 |
| Mar-19 | 3.8 | 4.5 | 4.2 |
| Jun-19 | 3.7 | 4.3 | 4 |
| Sep-19 | 3.8 | 4.5 | 4.2 |
| Dec-19 | 3.9 | 4.3 | 4.1 |
| Mar-20 | 4 | 4.4 | 4.2 |
| Jun-20 | 3.6 | 4.5 | 4 |
| Sep-20 | 4.8 | 5.8 | 5.3 |
| Dec-20 | 4.5 | 5.3 | 4.9 |
| Mar-21 | 4.6 | 4.6 | 4.6 |
| Jun-21 | 3.8 | 4.2 | 4 |
| Sep-21 | 3.3 | 3.4 | 3.3 |
| Dec-21 | 3.1 | 3.3 | 3.2 |
“This quarter’s unemployment rate is now the lowest rate recorded since the HLFS series began in 1986,” Ms Collett said.
Employment growth slows but perceived job security remains strong
The seasonally adjusted number of employed people remained relatively steady over the quarter, rising by 3,000 people to 2,831,000. This was a much more modest increase compared with last quarter.
Neither full-time nor part-time employment changed substantially over the quarter; however, both retained strong annual increases due to growth in the previous three quarters. The number of people in full-time employment increased 3.2 percent to 2,270,000, while those employed part-time increased by 5.7 percent to 567,000 people.
| Quarter | Employed full-time | Employed part-time |
| Dec-11 | 1691000 | 496000 |
| Mar-12 | 1681000 | 511000 |
| Jun-12 | 1699000 | 497000 |
| Sep-12 | 1679000 | 503000 |
| Dec-12 | 1696000 | 491000 |
| Mar-13 | 1713000 | 479000 |
| Jun-13 | 1722000 | 486000 |
| Sep-13 | 1743000 | 493000 |
| Dec-13 | 1752000 | 506000 |
| Mar-14 | 1778000 | 501000 |
| Jun-14 | 1790000 | 506000 |
| Sep-14 | 1811000 | 500000 |
| Dec-14 | 1831000 | 516000 |
| Mar-15 | 1846000 | 515000 |
| Jun-15 | 1850000 | 522000 |
| Sep-15 | 1854000 | 498000 |
| Dec-15 | 1870000 | 517000 |
| Mar-16 | 1896000 | 521000 |
| Jun-16 | 1961000 | 524000 |
| Sep-16 | 1964000 | 536000 |
| Dec-16 | 1998000 | 532000 |
| Mar-17 | 2013000 | 546000 |
| Jun-17 | 2023000 | 537000 |
| Sep-17 | 2052000 | 550000 |
| Dec-17 | 2067000 | 556000 |
| Mar-18 | 2081000 | 554000 |
| Jun-18 | 2111000 | 544000 |
| Sep-18 | 2119000 | 554000 |
| Dec-18 | 2133000 | 546000 |
| Mar-19 | 2144000 | 529000 |
| Jun-19 | 2158000 | 535000 |
| Sep-19 | 2174000 | 525000 |
| Dec-19 | 2189000 | 529000 |
| Mar-20 | 2202000 | 538000 |
| Jun-20 | 2196000 | 541000 |
| Sep-20 | 2164000 | 544000 |
| Dec-20 | 2199000 | 537000 |
| Mar-21 | 2191000 | 554000 |
| Jun-21 | 2217000 | 563000 |
| Sep-21 | 2259000 | 561000 |
| Dec-21 | 2270000 | 567000 |
In unadjusted numbers, 27,700 more people were in employment over the quarter, and 101,000 more employed people over the year. Over the year to December 2021, the number of paid employees rose 3.7 percent and within that, permanent employment increased 3.8 percent.
In the December 2021 quarter, 46.3 percent of employed people who were asked about their perceived job security thought there was almost no chance of involuntarily losing their job or business in the next 12 months, up from 42.5 percent last year.
“Some of the largest increases in employment over the year came from young people,” Ms Collett said.
“For instance, more 15- to 19-year-olds were employed in retail trade and accommodation and food services over the course of 2021.”
The seasonally adjusted labour force participation rate also remained high, at 71.1 percent.
Wages continue to rise
Average ordinary time hourly earnings rose 3.8 percent in the year to the December 2021 quarter to reach $35.61.
Average weekly earnings per full-time equivalent (FTE) employee in the QES also rose, up 1.8 percent over the quarter and 5.7 percent over the year.
Wage inflation, as measured by the labour cost index (LCI) for all salary and wage rates, was 2.6 percent in the year up to the December 2021 quarter.
Wages continue steady rise has more information on wage growth.
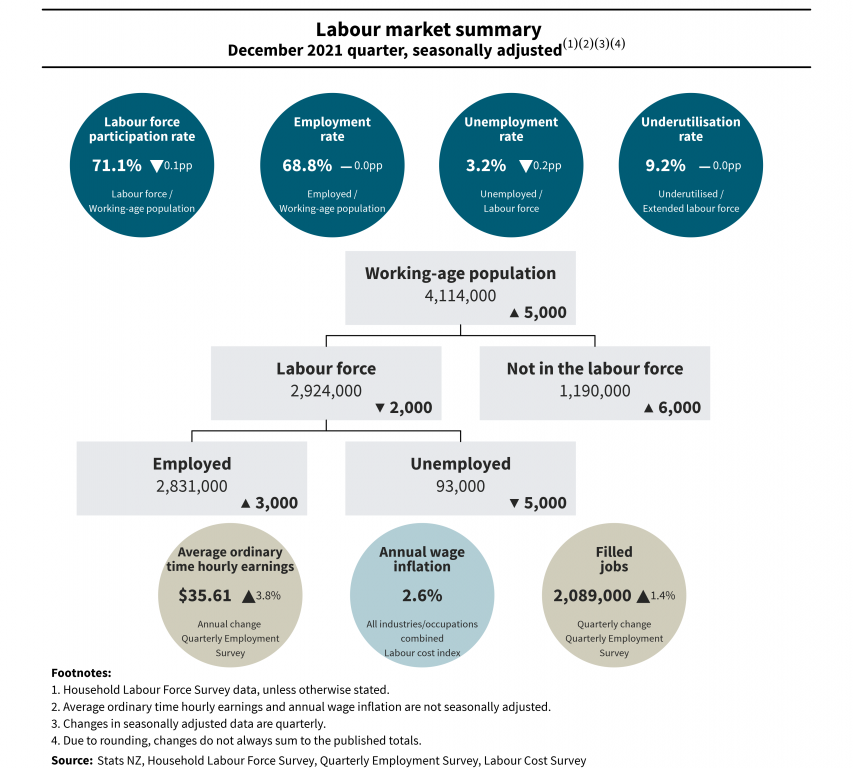
Text alternative for labour market summary, December 2021 quarter, seasonally adjusted diagram
Diagram shows data from December 2021 quarter’s Household Labour Force Survey (HLFS), Quarterly Employment Survey (QES), and Labour Cost Index (LCI).
HLFS results for the December 2021 quarter showed the labour force participation rate was 71.1 percent, down 0.1pp (percentage points). This rate is derived from labour force divided by working-age population. The employment rate was 68.8 percent, the same as last quarter. This is derived from employed divided by working-age population. The unemployment rate was 3.2 percent, down 0.2pp. This is derived from unemployed divided by labour force. The underutilisation rate was 9.2 percent, the same as last quarter. This is derived from total underutilised divided by extended labour force.
The working-age population was up 5,000 to 4,114,000. This is made up of the labour force, down 2,000 to 2,924,000, and people not in the labour force, up 6,000 to 1,190,000. The labour force is made up of employed people, up 3,000 to 2,831,000, and those unemployed, down 5,000 to 93,000.
Average ordinary time hourly earnings from the QES were up 3.8 percent annually, to $35.61.
Annual wage inflation from the LCI was 2.6 percent, for all industries and occupations combined.
Filled jobs from the QES were up 1.4 percent for the quarter, to 2,089,000.
Notes:
- Household Labour Force Survey data, unless otherwise stated.
- Average ordinary time hourly earnings and annual wage inflation are not seasonally adjusted.
- Changes in seasonally adjusted data are quarterly.
- Due to rounding, changes do not always sum to the published totals.
Source: Stats NZ, Household Labour Force Survey, Quarterly Employment Survey, and Labour Cost Survey.
Note: data quality and caution
In the December 2021 quarter, we experienced difficulty in our HLFS data collections, with lower achieved sample rates for South Auckland and Northland, due to COVID-19 restrictions.
This has added extra uncertainty to estimates for Pacific peoples and those regions. National level estimates remain accurate.
Labour market statistics: December 2021 quarter – Period specific information – DataInfo+ has more information about our data quality for this quarter and the affected subgroups.


/who-and-sesam-event-in-lyon.tmb-768v.jpg?sfvrsn=6788f1a1_1)
