Nathan Stall, a PhD student at U of T’s Dalla Lana School of Public Health, appears during a livestream webinar this week to discuss a new tool he helped develop that assists hospitals in planning for the COVID-19 pandemic.

A group of researchers at the University of Toronto’s Dalla Lana School of Public Health have developed an interactive online tool that helps hospitals and other health-care providers estimate their capacity to manage new cases of COVID-19.
By taking into account the number of acute and critical care resources available to a specific health-care provider, data on the age distribution and severity of COVID-19 cases and expected duration of patient stays, the online tool helps hospitals model their capacity to respond to the fast-moving pandemic.
“The tool determines the maximum number of new COVID-19 cases that a health-care system could manage,” said Nathan Stall, a PhD student at Dalla Lana and an internal medicine resident in the department of medicine at the Faculty of Medicine.
“It’s based on the age-based case distribution and expected proportion of those individuals who are going to be admitted to acute care, critical care or be mechanically ventilated.”
Stall presented the online tool during a webinar organized by the Dalla Lana School of Public Health on Tuesday. He was joined by fellow PhD students Isha Berry and Jean-Paul Soucy, who presented their own online dashboard that uses publicly available data to track COVID-19 cases in Canada.
The trio discussed the applications of their complementary creations and how they can be used to study the trajectory of the coronavirus pandemic and equip health systems to plan for surges in patients.
Ontario reported 100 new cases in the province on Wednesday, while the number of cases in Canada has surpassed 3,000, with 27 deaths.
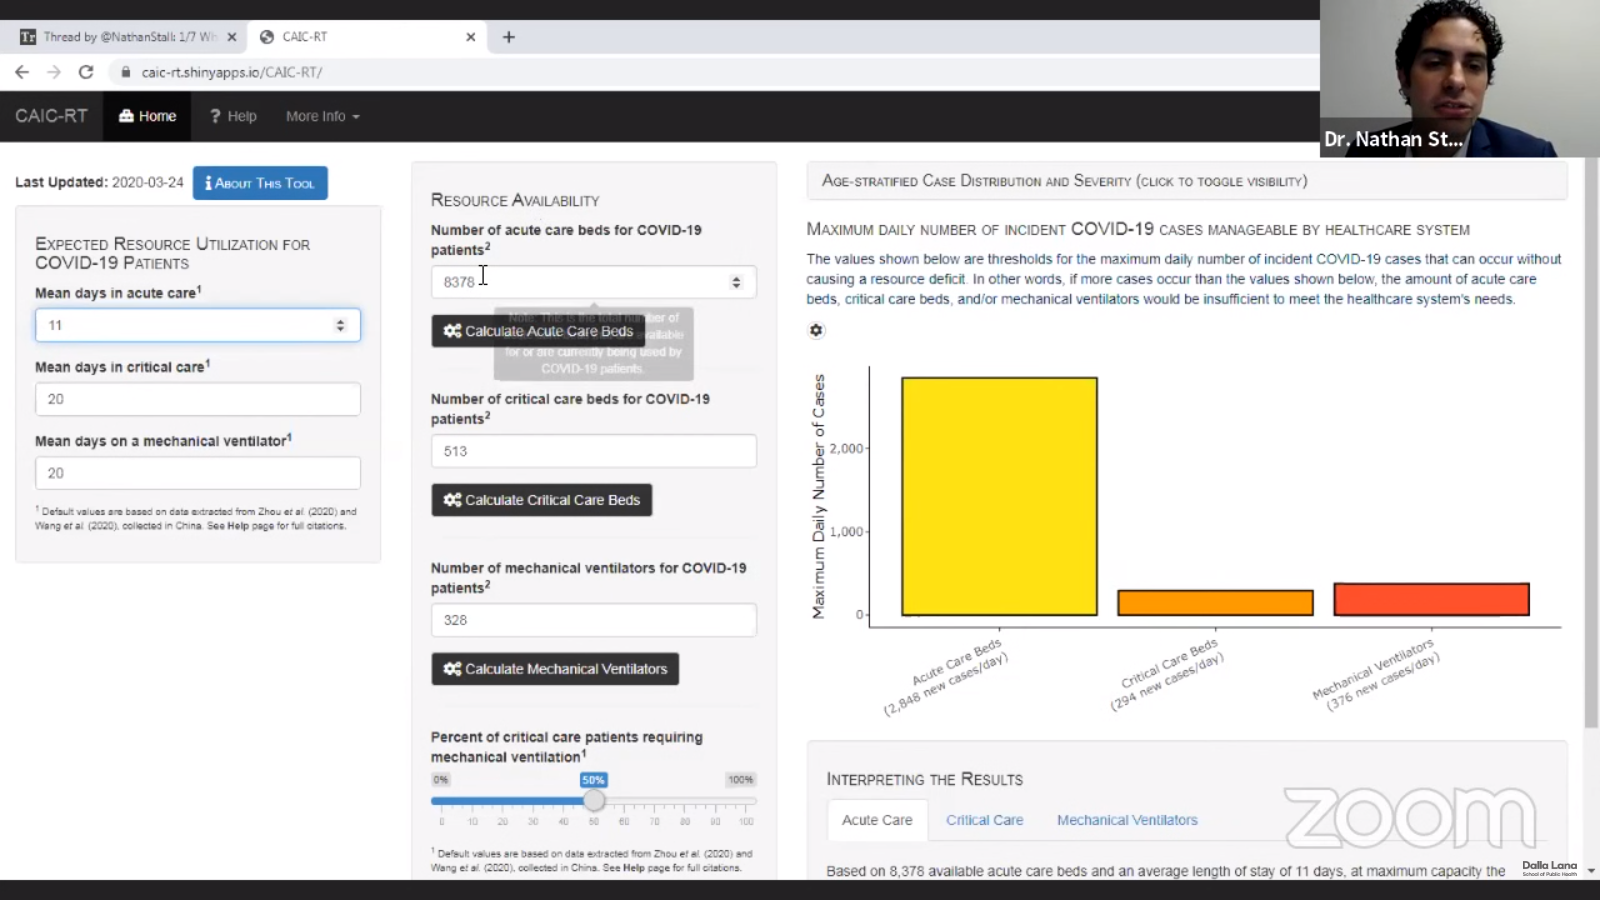
The resource availability tool co-developed by Nathan Stall lets users input a range of variables, including the number of acute care beds, critical care beds and mechanical ventilators available for COVID-19 patients.
Ross Upshur, professor in the department of family and community medicine in the Faculty of Medicine with a cross appointment at the Dalla Lana School of Public Health, lauded the tools as the latest example of how U of T experts are contributing to knowledge-creation and dialogue surrounding the pandemic.
“We’re now using the best of our capacity and some of the brightest young minds in the country to create tools that will help us create evidence-informed decisions,” said Upshur, who moderated the webinar discussion.
“Not only does it help us understand the dynamics of the pandemic, it helps us to respond. It’s looking at both the public health and clinical capacity side of things. The idea of how these two sectors work together is really germane to our response to COVID-19.”

Isha Berry and Jean-Paul Soucy, pictured here during the webinar, developed an online dashboard that uses publicly available data to track COVID-19 cases in Canada.
The resource availability tool co-developed by Stall lets users input a range of variables, including the number of acute care beds, critical care beds and mechanical ventilators available for COVID-19 patients and the expected percentage of COVID-19 patients who will require them.
By applying age distribution and case severity data to those figures, the tool produces a graph showing the maximum daily number of new COVID-19 cases that a given hospital or health-care authority can handle without suffering a resource deficit.
“It’s modifiable to local clinical experience and context. So a health-care system can say, ‘OK I have this many acute-care beds in my hospital or my health-care system,’ or you can look at it by region,” said Stall, who developed the tool with Vasily Giannakeas, an epidemiologist at Women’s College Hospital, Matthew Warkentin, a PhD student at Dalla Lana and doctoral researcher at the Lunenfeld-Tanenbaum Research Institute, Isaac Bogoch, an associate professor of infectious diseases in the department of medicine at the Faculty of Medicine and clinical investigator at the Toronto General Hospital Research Institute, and epidemiologist Deepit Bhatia.
Stall added that the tool takes into account the fact that hospital resources will also continue to be used by patients with other conditions. The feature makes the tool useful to health-care systems that might be acquiring new resources or shuffling them around to deal with the pandemic and need to figure out how to optimize the resources at their disposal, he said.
“Right now, we haven’t had the big bulge of cases that we’re anticipating and a lot of the work that’s going on now is doing this kind of planning,” said Stall. “How can we surge our capacity of critical care beds? Where are we on this curve in terms of cases? How can we convert less-acute services to virtual where possible?
“These are the kinds of difficult decisions that health-care policy-makers and planners at local and provincial levels are trying to make right now, and they’re critically important.”
Soucy, who co-developed the case-tracking dashboard, said the quality of care available to COVID-19 and other patients will depend heavily on “flattening the curve” – spreading infection cases over a long period of time to prevent hospitals from becoming overwhelmed.
“When it comes to flattening the curve and this idea of hospital capacity, it’s not just ventilators and ICU beds for people with COVID-19,” he said. “If you have car accidents, heart attacks and things like that, and you have a totally overwhelmed hospital, those people are going to have a worse shot getting out of there in one piece than if we had not had an overwhelmed health-care system.”
Berry said the impact of physical distancing measures adopted across Canada to help flatten the curve will be reflected in their data in one or two weeks.
“Hopefully what we will see is that, about two weeks from now, these cases will keep going a little bit more flat and won’t keep spiking up. Overall, what we hope is that we keep seeing a steady, longer curve as opposed to a high and spiky curve,” she said, adding the case-tracking tool could eventually incorporate new data such as mortality and the ability to project the trajectory of future cases using mathematical modelling.
For his part, Stall said he’s hopeful his tool and the dashboard developed by Berry and Soucy will make a contribution towards planning efforts.
“As Dr. Tedros Adhanom, the head of the World Health Organization, said, You can’t fight a fire if you’re going in blindfolded. We need good access to data, not only about the cases in our regions but access to the resources that are going to be available so that we can plan before we’re entirely overwhelmed.”
/Public Release. View in full here.


