The provisional net loss of 7,300 people in the year ended March 2022 was the lowest net migration for a March year since 2012, Stats NZ said today.
The net loss of 7,300 follows a provisional net loss of 1,700 in the March 2021 year, and a record net gain of 91,700 in the March 2020 year.
| Year ended March | Migrant arrivals | Migrant departures | Net migration |
| 2002 | 122621 | 75833 | 46788 |
| 2003 | 133470 | 74054 | 59416 |
| 2004 | 113329 | 81108 | 32221 |
| 2005 | 102404 | 91422 | 10982 |
| 2006 | 105175 | 91396 | 13779 |
| 2007 | 112476 | 96595 | 15881 |
| 2008 | 114817 | 104250 | 10567 |
| 2009 | 119362 | 105319 | 14043 |
| 2010 | 104250 | 89618 | 14632 |
| 2011 | 100702 | 106185 | -5483 |
| 2012 | 100721 | 116405 | -15684 |
| 2013 | 102204 | 108015 | -5811 |
| 2014 | 114646 | 87861 | 26785 |
| 2015 | 132040 | 80774 | 51266 |
| 2016 | 142777 | 79622 | 63155 |
| 2017 | 142588 | 81239 | 61349 |
| 2018 | 139003 | 88071 | 50932 |
| 2019 | 139036 | 89351 | 49685 |
| 2020 | 184884 | 93204 | 91680 |
| 2021 | 49190 | 50930 | -1740 |
| 2022 | 46066 | 53321 | -7256 |
“COVID-19 related travel and border restrictions, introduced in March 2020, disrupted travel and migration patterns. Migrant arrivals have dropped to levels seen in the mid-1980s and migrant departures have dropped to levels seen in the mid-1990s,” population indicators manager Tehseen Islam said.
New Zealand’s net migration has had ups and downs in the past, with the last period of annual net outflows from late-2010 to mid-2013.
Migration gains or losses are typically due to a combination of factors, which include relative economic and labour market conditions between New Zealand and the rest of the world, and immigration policy in New Zealand and other countries.
Migration affects population growth in New Zealand – see National population estimates: At 31 March 2022, published on 16 May 2022.
Net migration loss of non-New Zealand citizens continues
The provisional net migration loss of 7,300 in the March 2022 year was driven by a net loss of 9,400 non-New Zealand citizens, which more than offset a net gain of 2,100 New Zealand citizens.
“We continue to see a reversal of historical patterns, with the net loss of non-New Zealand citizens, and net gains of New Zealand citizens,” Mr Islam said.
“However, the net gain of 2,100 New Zealand citizens in the March 2022 year was down from a net gain of 16,000 in the March 2021 year, due to an increase in those departing overseas long term, and fewer arriving long term.”
The net migration loss of 9,400 non-New Zealand citizens was smaller than the March 2021 year, mostly due to an increase in those arriving long term.
New Zealand has usually had an annual net migration gain of non-New Zealand citizens and an annual net migration loss of New Zealand citizens.
Text alternative for diagram International migration estimates (provisional), year ended March 2022
Young adults drive net migration loss
While there was an overall net migration gain of New Zealand citizens in the March 2022 year, there was a net loss of those aged 18 to 27 years. The net migration loss of 1,800 in this age group compared with small net gains in the March 2020 and 2021 years.
Before the COVID-19 pandemic, the annual net migration loss of New Zealand citizens was driven by those in their late teens and twenties.
Most of the net loss of non-New Zealand citizens in the March 2022 year was in the 18 to 33-year-age group. This is similar to the March 2021 year. Before the COVID-19 pandemic this age group was a strong contributor to net migration gains of non-New Zealand citizens.
| Age at travel (years) | NZ citizens (2019) | NZ citizens (2020) | NZ citizens (2021) | NZ citizens (2022) | Non-NZ citizens (2019) | Non-NZ citizens (2020) | Non-NZ citizens (2021) | Non-NZ citizens (2022) |
| 0 | -685 | -549 | 60 | -108 | 541 | 611 | 51 | 75 |
| 1 | -194 | -93 | 261 | -25 | 855 | 1006 | 58 | 195 |
| 2 | -91 | 16 | 262 | 100 | 1089 | 1164 | 58 | 210 |
| 3 | -72 | 143 | 353 | 139 | 992 | 1179 | 57 | 217 |
| 4 | -51 | 66 | 240 | 64 | 1078 | 1135 | 23 | 165 |
| 5 | -92 | 99 | 228 | 62 | 1015 | 1164 | 18 | 146 |
| 6 | -57 | -40 | 183 | 24 | 811 | 1005 | -9 | 131 |
| 7 | -155 | -6 | 259 | 80 | 803 | 1081 | 6 | 99 |
| 8 | -33 | 75 | 232 | 48 | 814 | 945 | -26 | 81 |
| 9 | -2 | 92 | 217 | 49 | 693 | 892 | -27 | 54 |
| 10 | -75 | 60 | 227 | 81 | 638 | 830 | -23 | 19 |
| 11 | 3 | 75 | 209 | 72 | 646 | 907 | 7 | 33 |
| 12 | 66 | 144 | 222 | 84 | 713 | 829 | -27 | 18 |
| 13 | -10 | 67 | 176 | 97 | 659 | 803 | -43 | -4 |
| 14 | -1 | 56 | 164 | 107 | 891 | 965 | -41 | 22 |
| 15 | 9 | 101 | 191 | 94 | 1122 | 1208 | -75 | 37 |
| 16 | 29 | 73 | 105 | 58 | 906 | 911 | -81 | 47 |
| 17 | -87 | 66 | 62 | 28 | 587 | 488 | -270 | -71 |
| 18 | -508 | 43 | -7 | -70 | 1074 | 837 | -500 | -188 |
| 19 | -371 | 122 | -78 | -141 | 1203 | 1035 | -479 | -122 |
| 20 | -302 | 185 | -14 | -146 | 1156 | 1033 | -530 | -102 |
| 21 | -602 | 89 | 29 | -224 | 1103 | 1054 | -585 | -50 |
| 22 | -919 | -161 | 17 | -258 | 1550 | 1566 | -658 | -103 |
| 23 | -894 | -99 | 182 | -268 | 1665 | 2352 | -852 | -216 |
| 24 | -896 | 43 | 306 | -253 | 1756 | 2467 | -938 | -398 |
| 25 | -815 | 121 | 354 | -183 | 1801 | 2716 | -1011 | -514 |
| 26 | -658 | 241 | 433 | -175 | 1971 | 2852 | -1026 | -521 |
| 27 | -421 | 359 | 544 | -69 | 1922 | 2869 | -1069 | -655 |
| 28 | -203 | 476 | 646 | 24 | 1842 | 2632 | -1023 | -766 |
| 29 | 13 | 568 | 690 | 91 | 1535 | 2536 | -959 | -692 |
| 30 | -5 | 522 | 623 | 187 | 1771 | 2605 | -833 | -650 |
| 31 | -69 | 501 | 601 | 167 | 1640 | 2264 | -710 | -525 |
| 32 | 126 | 528 | 589 | 112 | 1337 | 1706 | -463 | -331 |
| 33 | 44 | 282 | 415 | 113 | 1330 | 1705 | -333 | -223 |
| 34 | -44 | 284 | 414 | 78 | 1485 | 1895 | -225 | -106 |
| 35 | 51 | 179 | 303 | 108 | 1391 | 1768 | -145 | -47 |
| 36 | -40 | 152 | 277 | 92 | 1517 | 1719 | -178 | -42 |
| 37 | -52 | 188 | 288 | 105 | 1329 | 1706 | -153 | -87 |
| 38 | -44 | 152 | 270 | 34 | 1226 | 1560 | -85 | -101 |
| 39 | -21 | 171 | 231 | 35 | 1129 | 1453 | -38 | -19 |
| 40 | -46 | 201 | 247 | 84 | 1058 | 1353 | -63 | -45 |
| 41 | 30 | 150 | 244 | 36 | 977 | 1167 | -22 | -69 |
| 42 | 24 | 86 | 222 | 49 | 849 | 1144 | -16 | -75 |
| 43 | -17 | 148 | 221 | 61 | 814 | 965 | -44 | 0 |
| 44 | 12 | 151 | 220 | 49 | 724 | 827 | 2 | -73 |
| 45 | -46 | 106 | 196 | 34 | 567 | 729 | -47 | -61 |
| 46 | 23 | 152 | 197 | 54 | 525 | 747 | -105 | -67 |
| 47 | 21 | 71 | 202 | 59 | 431 | 533 | -13 | -88 |
| 48 | -41 | 115 | 208 | 62 | 425 | 568 | -33 | -95 |
| 49 | -10 | 146 | 248 | 70 | 308 | 469 | -103 | -85 |
| 50 | -19 | 142 | 170 | 63 | 291 | 470 | -74 | -99 |
| 51 | -59 | 107 | 211 | 90 | 142 | 425 | -113 | -98 |
| 52 | -20 | 211 | 177 | 36 | 145 | 338 | -111 | -86 |
| 53 | 30 | 186 | 157 | 42 | 145 | 389 | -123 | -105 |
| 54 | 6 | 194 | 133 | 46 | 106 | 444 | -169 | -97 |
| 55 | 37 | 167 | 191 | 38 | 144 | 421 | -196 | -91 |
| 56 | 25 | 224 | 197 | 57 | 104 | 476 | -180 | -118 |
| 57 | 94 | 246 | 177 | 56 | 109 | 479 | -141 | -122 |
| 58 | 98 | 237 | 180 | 74 | 96 | 405 | -240 | -169 |
| 59 | 106 | 227 | 130 | 92 | 79 | 537 | -185 | -122 |
| 60 | 91 | 261 | 160 | 74 | 140 | 580 | -196 | -132 |
| 61 | 105 | 248 | 149 | 43 | 172 | 594 | -210 | -171 |
| 62 | 109 | 273 | 119 | 59 | 139 | 592 | -220 | -134 |
| 63 | 138 | 264 | 159 | 61 | 142 | 625 | -198 | -179 |
| 64 | 212 | 299 | 169 | 99 | 80 | 670 | -213 | -142 |
| 65 | 41 | 220 | 115 | 80 | 97 | 612 | -202 | -197 |
| 66 | 59 | 220 | 81 | 33 | 34 | 549 | -219 | -209 |
| 67 | 53 | 156 | 77 | 10 | 57 | 492 | -160 | -181 |
| 68 | 34 | 159 | 58 | 25 | 54 | 417 | -159 | -178 |
| 69 | 23 | 111 | 58 | 11 | 25 | 394 | -146 | -115 |
| 70 | -6 | 97 | 18 | 5 | 52 | 312 | -97 | -111 |
| 71 | 16 | 125 | 28 | -3 | 33 | 343 | -104 | -108 |
| 72 | 3 | 63 | 24 | 2 | 11 | 262 | -89 | -96 |
| 73 | 0 | 57 | 16 | -3 | 11 | 254 | -54 | -111 |
| 74 | 9 | 37 | -8 | -1 | 34 | 212 | -72 | -99 |
| 75 | 1 | 25 | 18 | 16 | 20 | 170 | -42 | -65 |
| 76 | -1 | 5 | 24 | 5 | 0 | 165 | -43 | -53 |
| 77 | -13 | 29 | 5 | 1 | 12 | 145 | -32 | -43 |
| 78 | -20 | 49 | 10 | 4 | 3 | 107 | -32 | -48 |
| 79 | -2 | 1 | -5 | -4 | 9 | 96 | -10 | -41 |
| 80+ | -63 | -30 | 8 | 22 | 25 | 423 | -103 | -198 |
Text alternative for diagram International migration estimates (provisional), year ended March 2022
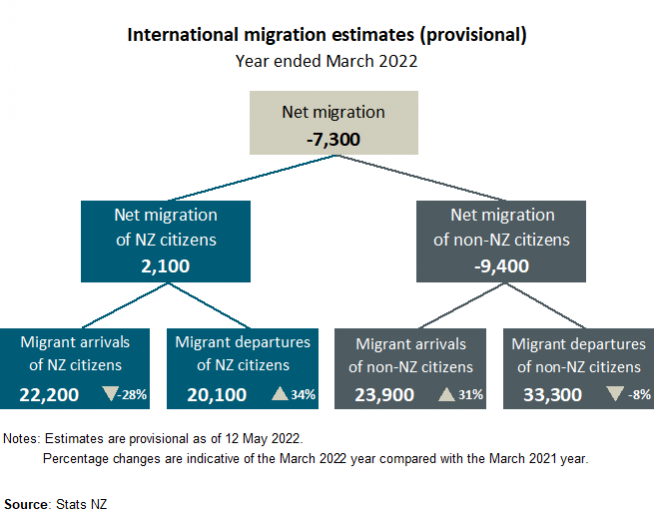
Diagram shows outcomes-based (provisional) estimates of migration, by citizenship (New Zealand or non-New Zealand) for the year ended March 2022. Overall, net migration is -7,300, made up of a net gain of 2,100 NZ citizens (based on 22,200 migrant arrivals, a 28 percent decrease on the year ended March 2021, and 20,100 migrant departures, a 34 percent increase) and a net loss of 9,400 non-NZ citizens (based on 23,900 migrant arrivals, a 31 percent increase on the year ended March 2021, and 33,300 migrant departures, an 8 percent decrease).


