International trade statistics provide information on imports and exports of goods and services between New Zealand and our trading partners.
- For the June 2026 quarter, revisions have been made back to the June 2014 quarter. As a result, the revised CSV file and the output_csv_full file contain identical data, so the revised CSV file has been omitted to save space.
Key facts
Quarterly goods and services by country
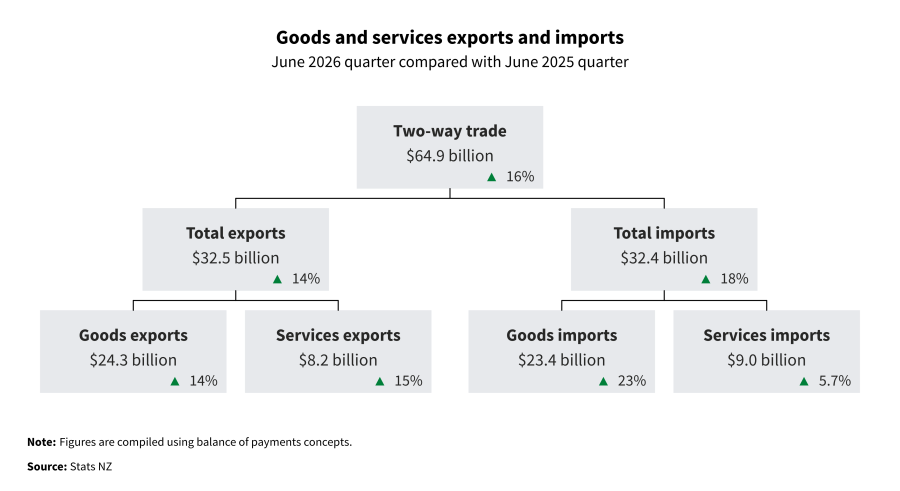
- Total exports of goods and services for the June 2026 quarter were $32.5 billion, up from $28.5 billion in the June 2025 quarter.
- Total imports of goods and services for the June 2026 quarter were $32.4 billion, up from $27.5 billion in the June 2025 quarter.
- The total two-way trade for the June 2026 quarter was $64.9 billion.
New Zealand international trade dashboard shows quarterly exports and imports data for goods and services by country and commodity type.
Total services exports rose $1.1 billion to $8.2 billion in the June 2026 quarter compared with the June 2025 quarter.
The top movements of our services export categories in the June 2026 quarter compared with the June 2025 quarter were:
- travel services, up $614 million to $3.9 billion
- transportation services, up $168 million to $1.1 billion
- other business services, up $110 million to $1.1 billion
- telecommunication services, up $93 million to $519 million
- charges for the use of intellectual property services, down $23 million to $412 million.
Total service imports rose $482 million to $9.0 billion in the June 2026 quarter compared with the June 2025 quarter.
The top movements of our services import categories in the June 2026 quarter compared with the June 2025 quarter were:
- other business services, up $304 million to $1.9 billion
- telecommunication services, up $117 million to $1.2 billion
- transportation services, up $105 million to $1.8 billion
- charges for the use of intellectual property services, up $39 million to $502 million
- financial services, down $87 million to $201 million.
Overseas trade indexes (OTI)
Movements are compared with the March 2026 quarter. All prices are unadjusted; all volumes and values are seasonally adjusted unless otherwise stated.
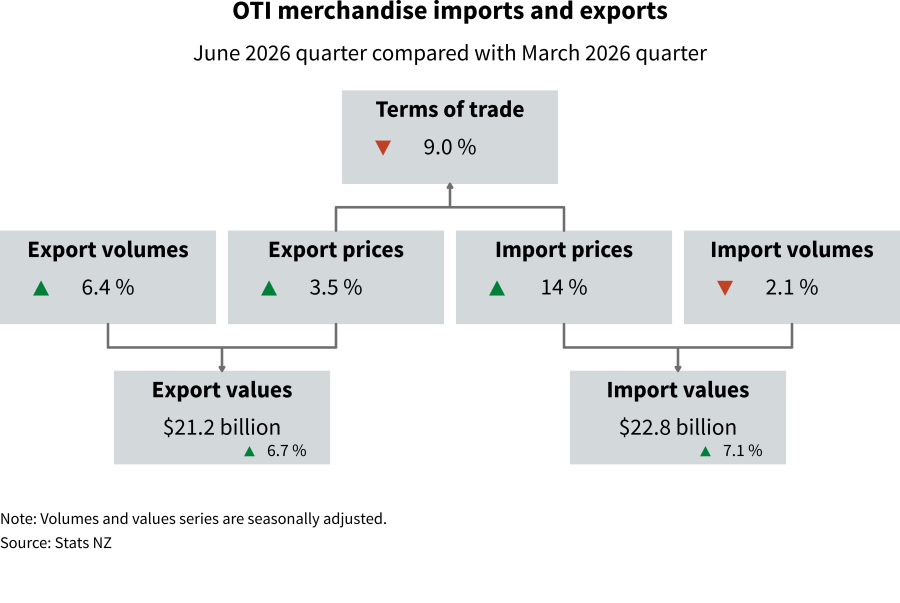
- The merchandise (goods) terms of trade fell 9.0 percent.
- Export prices for goods rose 3.5 percent and import prices rose 14 percent.
- Export volumes for goods rose 6.4 percent and import volumes fell 2.1 percent.
- Export values for goods rose 6.7 percent and import values rose 7.1 percent.
- The services terms of trade fell 2.1 percent.
- Services export prices rose 1.0 percent, while import prices rose 3.2 percent.
Exports
The following were the main contributors to the export movements in the June 2026 quarter:
- dairy prices rose 3.3 percent
- dairy volumes rose 3.9 percent, and values rose 2.9 percent
- meat prices rose 4.5 percent
- meat volumes rose 10 percent, and values rose 10 percent.
Imports
The following were the main contributors to the import movements in the June 2026 quarter:
- petroleum and petroleum product prices rose 79 percent
- petroleum and petroleum product volumes fell 9.0 percent, and values rose 63 percent.
(Note: these volumes and values are not seasonally adjusted.)
Text alternative for goods and services exports and imports, June 2026 quarter compared with June 2025 quarter
The diagram shows two-way trade was up 16 percent to $64.9 billion. On the left-hand side of the diagram, total exports were up 14 percent to $32.5 billion. Goods exports were up 14 percent to $24.3 billion, and services exports were up 15 percent to $8.2 billion. On the right-hand side of the diagram, total imports were up 18 percent to $32.4 billion. Goods imports were up 23 percent to $23.4 billion, and services imports were up 5.7 percent to $9.0 billion.
Note: Figures are compiled using balance of payments concepts.
Source: Stats NZ.
Text alternative for OTI merchandise imports and exports, June 2026 quarter compared with March 2026 quarter
The diagram shows the terms of trade fell 9.0 percent, where export prices rose 3.5 percent and import prices rose 14 percent. The value of exports rose 6.7 percent to $21.2 billion. Flowing into this were export volumes which rose 6.4 percent, and export prices which rose 3.5 percent. The value of imports rose 7.1 percent to $22.8 billion. Flowing into this were import volumes which fell 2.1 percent, and import prices which rose 14 percent.
Note: Volumes and values series are seasonally adjusted.
Source: Stats NZ.
New Zealand trade dashboard – survey
New Zealand trade dashboard lets you explore New Zealand’s good and services trade by country and commodity type.
We’re seeking feedback about how you use trade data and the dashboard. Complete the Trade dashboard user survey to help us improve our trade data products.
More data
Use Infoshare to access time-series data.
Goods trade data
Subject category: Imports and exports
Group: Exports – summary data
Group: Imports – summary data
Group: Overseas trade statistics
Group: Re-exports – summary data
Overseas trade indexes
Subject category: Imports and exports
Group: Overseas trade indexes – prices – OTP
Group: Overseas trade indexes – volumes and values – OTV
Definitions and metadata
International trade statistics – DataInfo+ has metadata, methodologies, and definitions used in this release.
Infoshare is being replaced by Aotearoa Data Explorer
Infoshare is being replaced by Aotearoa Data Explorer. Stay informed and get support with this change by joining our customer group at [email protected].
Technical enquiries
International accounts team
[email protected]
04 931 4600
ISSN 2703-6618
Next release
International trade: September 2026 quarter will be released on 2 December 2026.