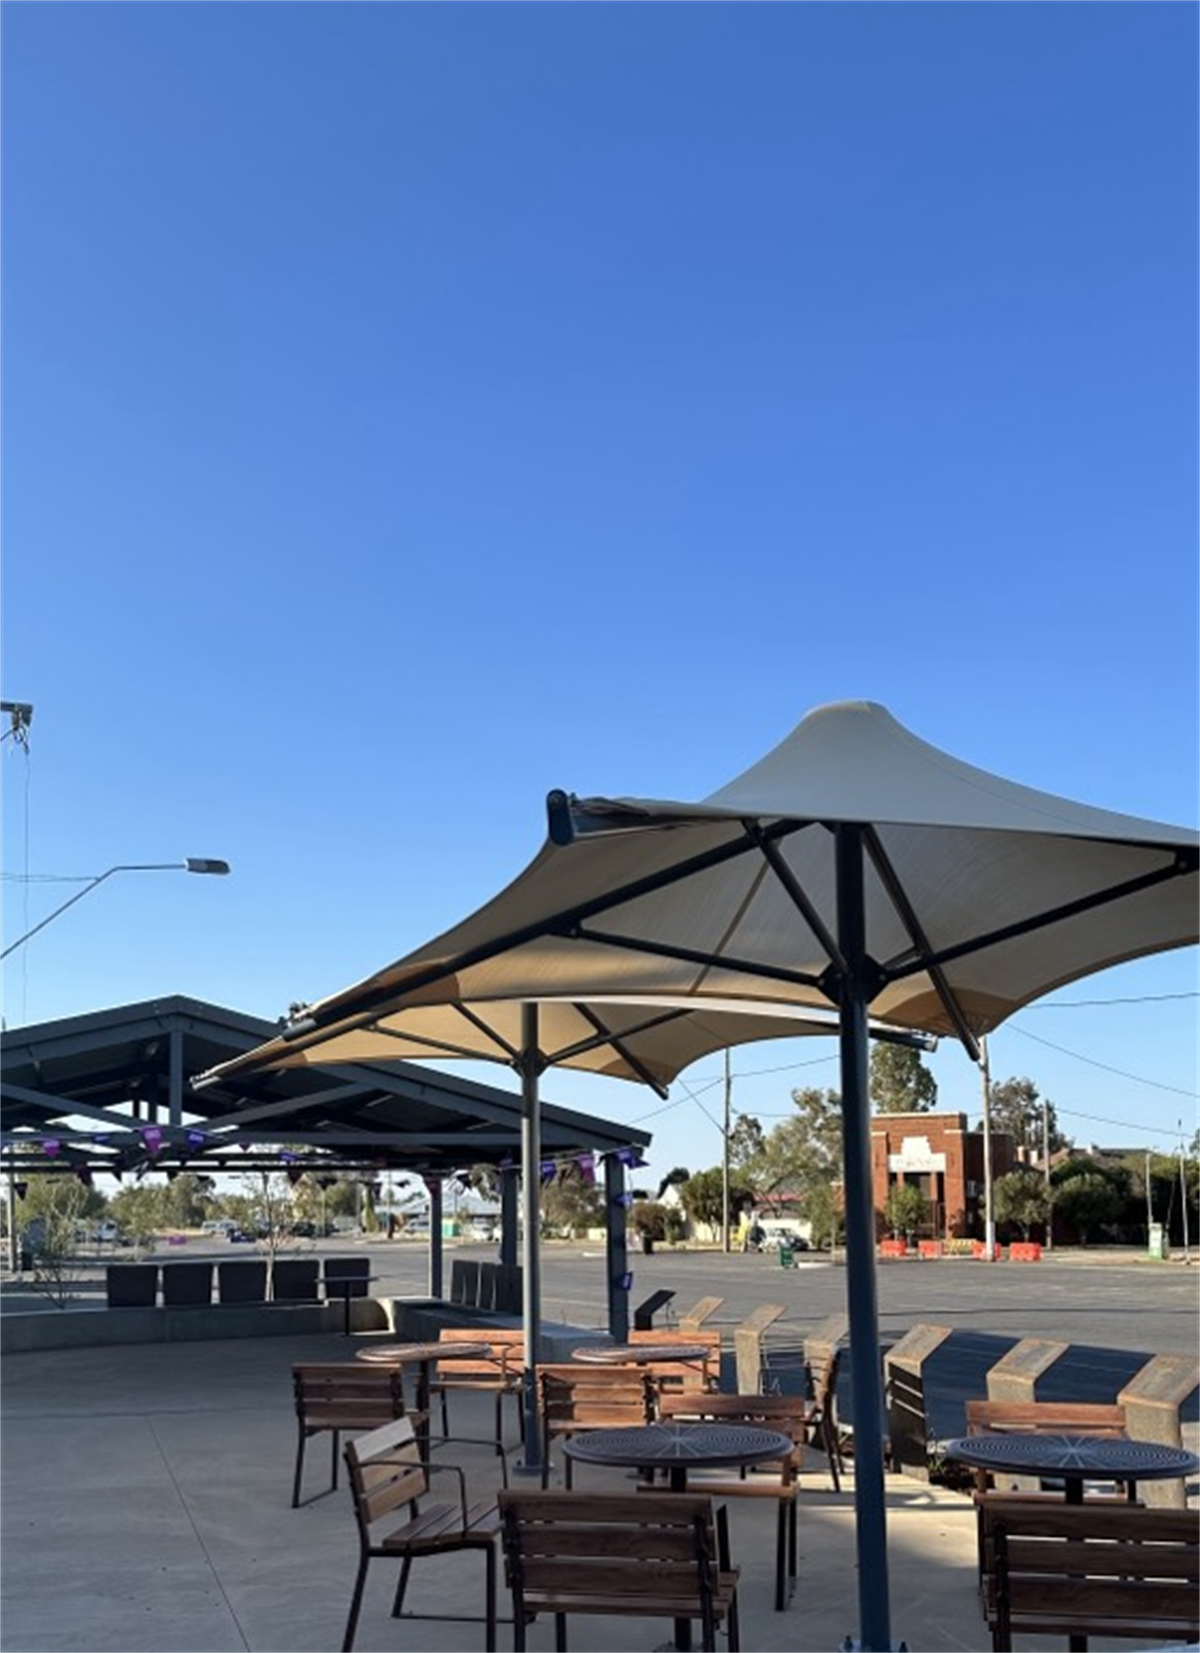
Retail card spending on eating out recovered in October, as Auckland moved out of COVID-19 alert level 2, Stats NZ said today.
In actual terms, spending at restaurants, cafes, and takeaways (food and beverage services) was up $79 million (8.8 percent) compared to October 2019.
This is the second highest monthly spend for food and beverage services in over 20 years, almost as high as the Christmas peak in December last year.
“Auckland moved down to COVID-19 alert level 1 on 8 October, loosening previous restrictions on social gatherings. This meant more people could gather for events and celebrations again, after crowd limits were imposed in earlier months,” business statistics manager Sue Chapman said.
| Month | Accommodation | Food and beverage services |
| Oct-18 | 215131000 | 837449000 |
| Nov-18 | 238334000 | 860472000 |
| Dec-18 | 256489000 | 947912000 |
| Jan-19 | 283262000 | 872199000 |
| Feb-19 | 258163000 | 824297000 |
| Mar-19 | 259200000 | 928857000 |
| Apr-19 | 221331000 | 857441000 |
| May-19 | 177381000 | 869461000 |
| Jun-19 | 163244000 | 844267000 |
| Jul-19 | 186658000 | 865520000 |
| Aug-19 | 186649000 | 886725000 |
| Sep-19 | 186976000 | 858385000 |
| Oct-19 | 213478000 | 897189000 |
| Nov-19 | 239510000 | 924391000 |
| Dec-19 | 258089000 | 988596000 |
| Jan-20 | 284443000 | 928529000 |
| Feb-20 | 262212000 | 892875000 |
| Mar-20 | 162500000 | 662446000 |
| Apr-20 | 12819000 | 43743000 |
| May-20 | 54687000 | 564614000 |
| Jun-20 | 109696000 | 823808000 |
| Jul-20 | 157098000 | 957378000 |
| Aug-20 | 109559000 | 771540000 |
| Sep-20 | 133441000 | 860279000 |
| Oct-20 | 167262000 | 976349000 |
Spending on hotels, motels, and other accommodation was down $46 million (22 percent) compared with October 2019.
“The lack of international visitors is still hampering the accommodation industry, despite a small recovery in October, coinciding with the return to alert level 1,” Ms Chapman said.
Hardware and sports and camping equipment see pre-summer sales glow
Card spending on long-lasting goods (durables) had the largest retail industry rise, up $244 million (17 percent) from October 2019.
The rise in durables was mainly driven by furniture, electrical, and hardware retailing, up $138 million (20 percent) over the year to the highest October month value since the series began.
| Industry | Oct-18 | Oct-19 | Oct-20 |
| ” Furniture | 674212000 | 674427000 | 812193000 |
| electrical and hardware retailing” | 128787000 | 133123000 | 169607000 |
| Recreational goods | 290037000 | 314220000 | 343124000 |
| Department stores | 309044000 | 322544000 | 362993000 |
| Pharmaceutical and other store-based retailing |
Sporting and outdoor activity equipment (recreational goods) saw the largest percentage increase of the four durables sub-industries, rising 27 percent from October 2019.
“Long-lasting goods businesses saw sales increases in items such as gardening and outdoor furniture as well as camping and sporting goods,” Ms Chapman said.
“People are setting up their homes, gearing up for fun summer activities and domestic travel, using money that may have been spent on overseas travel.”
Total retail card spending increases
In actual terms, total retail spending using electronic cards was $6.2 billion in October 2020, up $472 million (8.2 percent) from October 2019.
| Month | 2018 | 2019 | 2020 |
| Nov | 5611925000 | 5874061000 | 6171222000 |
| Dec | 6857121000 | 6936024000 | 7209206000 |
| Jan | 5447024000 | 5653182000 | 5891439000 |
| Feb | 5056625000 | 5238730000 | 5691140000 |
| Mar | 5698874000 | 5754460000 | 5651491000 |
| Apr | 5211612000 | 5470002000 | 2870608000 |
| May | 5336930000 | 5520094000 | 5188203000 |
| Jun | 5202179000 | 5280275000 | 5701230000 |
| Jul | 5255893000 | 5359308000 | 5968957000 |
| Aug | 5319596000 | 5485007000 | 5438997000 |
| Sep | 5314370000 | 5345536000 | 5734401000 |
| Oct | 5680681000 | 5769564000 | 6241153000 |
Total retail card spending for the January to October period was $54.4 billion in 2020, down 0.9 percent compared with $54.9 billion in 2019. Comparatively, from 2018 to 2019, there was a 2.5 percent increase in spending.
“Several months of higher retail spending have almost made up for record low spending in April, though some industries have fared better than others,” Ms Chapman said.
The only industries to see falls in October were fuel and non-retail (excluding services).
Fuel was down $65 million (11 percent) over the year, mainly reflecting lower petrol prices.
Non-retail (excluding services) was down $244 million (13 percent) – this category includes travel and tour arrangement services heavily affected by international border restrictions, rental and hiring services, and gambling.


