E ngā iwi, e ngā reo, e ngā whakahuahuatanga maha, tēnā koutou katoa.
Tēnei te mihi atu ki a koutou i roto i ngā tini āhuatanga o te wā. E mihi ana ki a koutou mō koutou i tahuri mai ki te tautoko i ngā mahi, i tuku hoki i ā koutou mōhiotanga, kōrero ki a mātou. E mōhio ana mātou he taonga nui ngā kōrero o te iwi, o te hapū, o te hapori, me te whānau. Nō reira, ka nui te mihi atu ki a koutou katoa. Tēnei te tāpae atu nei i tēnei kohinga tatauranga ā-tau mō ngā umanga Māori o te motu, e kitea ai ngā tini āhuatanga o ēnei kōkiri nui o te ao Māori. He tini ngā painga, he tini hoki ngā tūmanako mō ēnei mahi a tātou. Nō reira tēnā koutou katoa.
We would like to acknowledge all of those who contributed to this data release by providing data through various surveys and other means. We thank you for your support and for sharing your knowledge and information with us. We understand that the information of iwi, hapū, the community, and whānau are treasured, therefore we greatly appreciate your willingness to share such treasures with us.
Tatauranga umanga Māori – Statistics on Māori businesses: 2025 presents information on two subsets of Māori businesses – Māori authorities and other Māori enterprises (Māori businesses that are economically significant but are not Māori authorities) – that contribute to our country’s economy. This release also includes data on Māori tourism businesses that may be either Māori authorities or other Māori enterprises. It does not cover all Māori businesses in Aotearoa New Zealand.
Tatauranga umanga Māori – Statistics on Māori businesses: 2025 (te reo Māori) is also available.
Key facts
In 2025:
- 1,362 Māori authorities and 4,488 other Māori enterprises were identified for this release
- of the total 5,850 businesses, 438 (7.5 percent) were identified as Māori tourism businesses
- 17 percent of Māori geographic units were located in the Auckland region
- Māori authorities employed around 12,500 people while other Māori enterprises employed around 43,200 people
- around 21 percent of Māori authorities operated in primary industries
- there was a total of 684,900 hectares of land on Māori farms
- Māori authorities exported $872 million worth of goods, 24 percent of this to China
- other Māori enterprises exported $574 million worth of goods
- the total income for Māori authorities was $5.7 billion, up 1.4 percent from the 2024 financial year.
Māori authorities are economically significant businesses involved in the collective management of assets held by Māori. Any business within a Māori authority ownership group is also included for the purposes of Tatauranga umanga Māori releases.
‘Other Māori enterprises’ in this release refers to Māori businesses that are economically significant and are not Māori authorities.
Definitions and metadata has more information on how we identified businesses included in this release.
Māori tourism businesses may be either Māori authorities or other Māori enterprises. They include businesses involved in activities such as accommodation, food, transport, arts and recreation, and administration and support services.
Population changes for 2025 release
The number of other Māori enterprises in this release has increased compared with previous releases, due to the identification of additional Māori businesses. Therefore, the data here differs from data published in previous Tatauranga umanga Māori releases.
Overview of population changes has more information about these changes.
Topics
Business demography by industry
Employment
Business demography by region
LEED data
Agriculture
Exports of commodities
Financial performance
Definitions and metadata
Overview of population changes
Data updates to Tatauranga umanga Māori
Business demography by industry
Māori authorities
There were 1,362 Māori authority businesses identified as operating in 2025, a decrease of 6 (0.4 percent) compared with 2024.
One-fifth (21 percent) of Māori authorities were in the primary industries, and one-third (33 percent) were non-residential property operators – that is, businesses that rent out non-residential properties, such as agricultural land and office space.
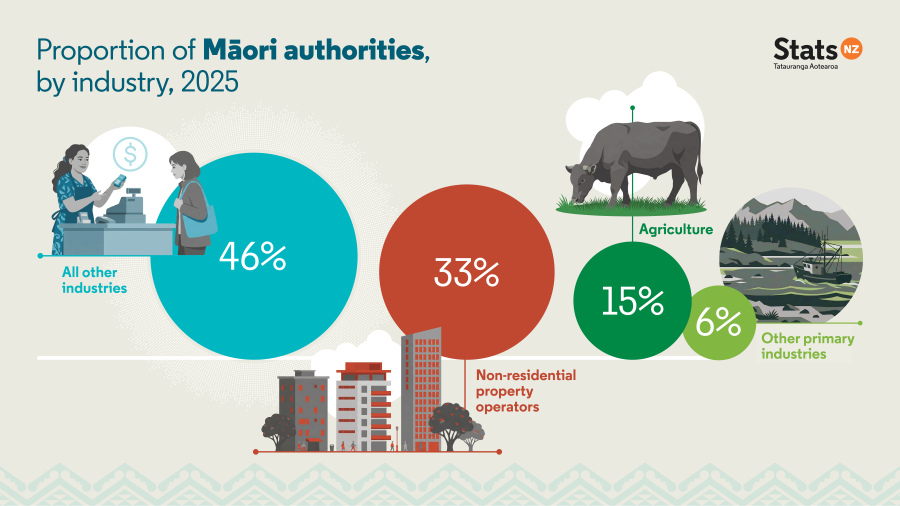
Text alternative for Proportion of Māori authorities, by industry, 2025
Other Māori enterprises
In this release, we report on 4,488 other Māori enterprises, with businesses across a range of industries. The top industries were:
- professional, scientific, and technical services (834 businesses)
- agriculture, forestry, and fishing (756 businesses)
- construction (495 businesses)
- health care and social assistance (315 businesses).
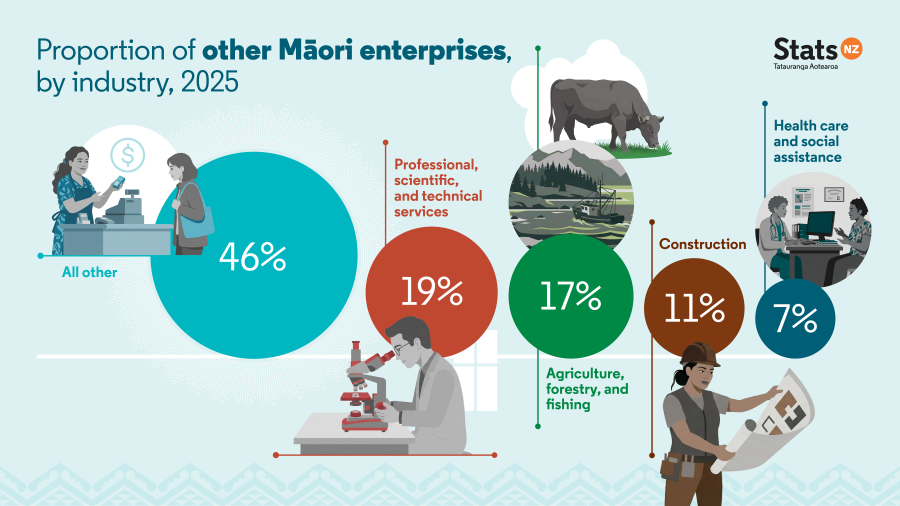
Text alternative for Proportion of other Māori enterprises, by industry, 2025
Māori tourism businesses
This release includes 438 Māori tourism businesses across the following range of tourism-specific industries:
- arts and recreation services – 192 businesses (44 percent)
- accommodation and food services – 147 businesses (34 percent)
- transport, postal, and warehousing – 33 businesses (7.5 percent)
- administrative and support services – 30 businesses (6.8 percent)
- all other industries – 36 businesses (8.2 percent).
Employment
Employee count for Māori authorities
The number of people employed by Māori authorities fell by 200 (1.6 percent) between 2024 and 2025, to 12,500.
The industry with the highest number of employees was agriculture, followed by other primary industries:
- 17 percent of all employees of Māori authorities were employed in agriculture
- 11 percent were employed in other primary industries.
| Year | Agriculture | Other primary industries | Non-residential property operators | All other industries |
| 2017 | 1650 | 1150 | 340 | 7900 |
| 2018 | 1650 | 1100 | 330 | 8200 |
| 2019 | 1850 | 1350 | 350 | 8500 |
| 2020 | 1900 | 1350 | 350 | 8900 |
| 2021 | 1900 | 1250 | 430 | 7200 |
| 2022 | 1900 | 1350 | 430 | 8300 |
| 2023 | 2100 | 1350 | 490 | 8100 |
| 2024 | 2250 | 1300 | 490 | 8700 |
| 2025 | 2100 | 1350 | 500 | 8600 |
Employee count for other Māori enterprises
The number of people employed by other Māori enterprises was 43,200 in 2025, down 3,200 employees (6.9 percent) from 2024.
| Year | Count of employees |
| 2017 | 27500 |
| 2018 | 30600 |
| 2019 | 32700 |
| 2020 | 35500 |
| 2021 | 37800 |
| 2022 | 43600 |
| 2023 | 44600 |
| 2024 | 46400 |
| 2025 | 43200 |
In 2025 compared with 2024, the number of employees in other Māori enterprises changed as follows:
- administrative and support services industry, down 13 percent (800 employees)
- construction industry, down 11 percent (700 employees)
- agriculture, forestry, and fishing industry, down 10 percent (400 employees)
- professional, scientific, and technical services industry, down 9.0 percent (400 employees)
- health care and social assistance industry, up 3.8 percent (400 employees).
Employee count for Māori tourism businesses
The total number of people employed by Māori tourism businesses in 2025 was 3,950, down 300 employees (7.1 percent) from 2024.
| Year | Count of employees |
| 2017 | 3400 |
| 2018 | 3450 |
| 2019 | 3550 |
| 2020 | 3950 |
| 2021 | 3250 |
| 2022 | 3250 |
| 2023 | 4000 |
| 2024 | 4250 |
| 2025 | 3950 |
| Year | Count of businesses |
| 2017 | 345 |
| 2018 | 360 |
| 2019 | 387 |
| 2020 | 402 |
| 2021 | 414 |
| 2022 | 441 |
| 2023 | 459 |
| 2024 | 468 |
| 2025 | 438 |
Employee numbers decreased in most Māori tourism industries. The biggest movements by industry in 2025 compared with 2024 were:
- accommodation and food services, down 13 percent (300 employees)
- administrative and support services, up 5.0 percent (10 employees)
- transport, postal, and warehousing, down 2.5 percent (10 employees).
Business demography by region
Counts presented in this section are at the geographic unit level. A geographic unit is a business location engaged in one, or mainly one, kind of economic activity at a single physical site or base (for example, a factory, a farm, a shop, a school, or an office). Therefore, the total number of geographic units and employees reported in this section will differ from the business and employee counts in the sections above.
Count of Māori geographic units by region
In 2025, there were 6,687 Māori geographic units across Aotearoa New Zealand.
Most Māori geographic units (5,604 units, 84 percent) were in the North Island. Of the total Māori geographic units, the regions with the most units were:
- Auckland, 1,146 geographic units (17 percent)
- Bay of Plenty, 1,101 geographic units (16 percent)
- Waikato, 876 geographic units (13 percent)
- Wellington, 648 geographic units (10 percent).
In the South Island, there were 1,053 Māori geographic units (16 percent). Areas outside the North and South Islands, or ‘Area outside region’, had 21 Māori geographic units (0.3 percent).
Count of employees of Māori geographic units by region
In 2025, Māori geographic units had 56,400 employees across Aotearoa New Zealand. The regions with the highest number of these employees were:
- Auckland, 13,700 employees (24 percent)
- Bay of Plenty, 7,600 employees (13 percent)
- Waikato, 6,400 employees (11 percent)
- Wellington, 5,500 employees (10 percent).
In the South Island, there were 10,300 employees (18 percent). Areas outside the North and South Islands (Area outside region) had 70 employees (0.1 percent).
New Zealand business demography statistics: At February 2025 has information on business and employee counts for all New Zealand businesses.
Business demography statistics – DataInfo+ has more information about this data, including general methodology about the collection, definitions for terms used, and data accuracy.
LEED data
LEED data for Māori authorities
Linked employer-employee data (LEED) includes measures on filled jobs and worker turnover rates. A quarterly measure is used to calculate worker turnover rates, so this section contains quarterly references rather than annual comparisons.
Filled jobs is defined as the number of jobs on the 15th day of the middle month of the reference quarter. There is no distinction between full- or part-time jobs. Due to the difference in reference periods and methodology, the number of filled jobs may differ from the number of employees presented in the business demography section.
In the March 2025 quarter, Māori authorities accounted for a total of 11,870 filled jobs. Filled jobs for Māori authorities fell 1.8 percent (220 filled jobs) from the December 2024 quarter. Compared with the March 2024 quarter, filled jobs for Māori authorities fell 1.9 percent (230 filled jobs).
Worker turnover rate is a measure of workforce stability, with a lower rate meaning more stability. It is a ratio of the average number of employees who have joined and who have left employers since the previous reference date, compared with the average total number of jobs over the two periods.
Worker turnover rate for Māori authorities in the March 2025 quarter was 15 percent, unchanged from the December 2024 quarter. Compared with the March 2024 quarter, the worker turnover rate for Māori authorities fell 2.2 percentage points.
| Quarter | Māori authorities | Other Māori enterprises | All New Zealand businesses |
| Mar-17 | 19.0 | 18.7 | 16.6 |
| Jun-17 | 16.9 | 20.0 | 17.1 |
| Sep-17 | 15.4 | 17.9 | 14.6 |
| Dec-17 | 16.6 | 18.3 | 14.7 |
| Mar-18 | 21.4 | 21.2 | 20.5 |
| Jun-18 | 21.2 | 20.1 | 18.6 |
| Sep-18 | 19.0 | 18.2 | 15.3 |
| Dec-18 | 16.0 | 19.0 | 15.0 |
| Mar-19 | 19.1 | 19.7 | 16.8 |
| Jun-19 | 16.3 | 20.5 | 16.3 |
| Sep-19 | 15.3 | 19.9 | 14.9 |
| Dec-19 | 17.3 | 18.8 | 14.7 |
| Mar-20 | 15.3 | 19.4 | 16.3 |
| Jun-20 | 13.4 | 16.5 | 13.4 |
| Sep-20 | 15.0 | 17.3 | 12.6 |
| Dec-20 | 15.8 | 18.0 | 13.1 |
| Mar-21 | 15.3 | 18.8 | 14.4 |
| Jun-21 | 16.0 | 19.8 | 17.6 |
| Sep-21 | 17.0 | 19.8 | 14.6 |
| Dec-21 | 17.0 | 17.9 | 13.7 |
| Mar-22 | 16.7 | 20.6 | 15.4 |
| Jun-22 | 15.4 | 19.3 | 16.8 |
| Sep-22 | 15.3 | 18.4 | 14.6 |
| Dec-22 | 15.1 | 18.4 | 14.7 |
| Mar-23 | 18.3 | 18.4 | 15.4 |
| Jun-23 | 15.3 | 20.0 | 17.4 |
| Sep-23 | 15.5 | 17.5 | 13.8 |
| Dec-23 | 15.8 | 16.2 | 13.5 |
| Mar-24 | 17.2 | 18.6 | 15.1 |
| Jun-24 | 17.0 | 17.0 | 14.2 |
| Sep-24 | 15.0 | 15.3 | 12.3 |
| Dec-24 | 15.0 | 15.0 | 12.0 |
| Mar-25 | 15.0 | 15.4 | 12.5 |
LEED data for other Māori enterprises
In the March 2025 quarter, other Māori enterprises accounted for a total of 41,350 filled jobs. Filled jobs for other Māori enterprises fell 3.5 percent (1,490 filled jobs) from the December 2024 quarter. Compared with the March 2024 quarter, filled jobs for other Māori enterprises fell 5.4 percent (2,370 filled jobs).
Worker turnover rate for other Māori enterprises in the March 2025 quarter was 15.4 percent, up 0.4 percentage points from the December 2024 quarter. Compared with the March 2024 quarter, the worker turnover rate for other Māori enterprises fell 3.2 percentage points.
LEED quarterly technical notes has more detail about measuring worker turnover.
Linked employer-employee data: March 2025 quarter has information on filled jobs and worker turnover rates for all New Zealand businesses.
Guide to interpreting the LEED Data has more information on worker turnover rates.
Agriculture
For statistical purposes, a farm denotes one or more blocks of land managed as a single operation and engaged in agricultural activity. Māori farms are geographical units belonging to Māori authorities or other Māori enterprises. Activities include livestock farming, horticulture, viticulture, nurseries, forestry, growing grain, and seed crops.
Māori farmland
There was a total of 684,900 hectares of land on Māori farms in 2025, representing 5.3 percent of total New Zealand farmland.
This land consisted of:
- grassland – 334,700 hectares (4.8 percent of the national total)
- horticulture land – 6,400 hectares (4.9 percent of the national total)
- exotic forestry plantation – 154,400 hectares (8.1 percent of the national total)
- bush and scrub – 126,300 hectares (10.9 percent of the national total)
- all other land (including tussock and arable land) – 63,200 hectares (2.3 percent of the national total).
Livestock on Māori farms
At 30 June 2025, Māori farms had the following livestock:
- sheep – 1.2 million (5.3 percent of national total)
- beef cattle – 206,600 (5.4 percent of national total)
- dairy cattle – 160,100 (2.8 percent of the national total)
- deer – 8,900 (1.2 percent of the national total).
| Livestock type | Māori farms | All New Zealand farms |
| Total sheep | 4414 | 1534 |
| Total beef cattle | 463 | 176 |
| Total dairy cattle | 698 | 475 |
| Total deer | 602 | 684 |
Agricultural production statistics: Year to June 2025 has data about agricultural businesses across Aotearoa New Zealand.
Agricultural production survey 2025 – DataInfo+ has information about agricultural production statistics, including general methodology about the collection, and data accuracy.
Exports of commodities
Exports of commodities reported in this release include those directly exported by Māori authorities and other Māori enterprises. Māori enterprises may on-sell their goods to other enterprises who export on their behalf.
Exports of goods by Māori authorities
Māori authorities exported $872 million worth of goods in 2025, a fall of 3.7 percent compared with 2024. Exports to China made up 24 percent of Māori authority exports, down from 27 percent in the previous year. Exports to countries other than China and the United States of America made up 72 percent of Māori authority exports, up from 70 percent in 2024.
| Year | People’s Republic of China | United States of America | Other |
| 2017 | 313000000 | 48000000 | 314000000 |
| 2018 | 350000000 | 45000000 | 344000000 |
| 2019 | 330000000 | 46000000 | 402000000 |
| 2020 | 273000000 | 41000000 | 474000000 |
| 2021 | 344000000 | 43000000 | 561000000 |
| 2022 | 284000000 | 49000000 | 535000000 |
| 2023 | 239000000 | 37000000 | 540000000 |
| 2024 | 240000000 | 31000000 | 633000000 |
| 2025 | 213000000 | 27000000 | 632000000 |
Kaimoana accounted for 46 percent of all exports by Māori authorities in 2025.
Exports of goods by other Māori enterprises
Other Māori enterprises exported a total of $574 million in 2025, a rise of 6.9 percent from 2024. Of all exports by other Māori enterprises:
- $49 million (8.5 percent) were to the United States of America
- $44 million (7.7 percent) were to Australia.
| Year | Australia | United States of America | European Union | Pacific Islands Forum (excluding Australia) | Other |
| 2017 | 8000000 | 7000000 | 3000000 | 1000000 | 262000000 |
| 2018 | 13000000 | 10000000 | 4000000 | 2000000 | 279000000 |
| 2019 | 14000000 | 12000000 | 11000000 | 3000000 | 278000000 |
| 2020 | 16000000 | 21000000 | 12000000 | 2000000 | 311000000 |
| 2021 | 23000000 | 26000000 | 9000000 | 2000000 | 345000000 |
| 2022 | 31000000 | 21000000 | 5000000 | 2000000 | 393000000 |
| 2023 | 43000000 | 32000000 | 8000000 | 2000000 | 428000000 |
| 2024 | 36000000 | 30000000 | 16000000 | 2000000 | 452000000 |
| 2025 | 44000000 | 49000000 | 19000000 | 1000000 | 461000000 |
Overseas merchandise trade: December 2025 provides information on imports and exports of merchandise goods for all New Zealand businesses.
Financial performance
In the 2025 financial year, the total income reported by Māori authorities was $5.7 billion, up 1.4 percent ($79 million) from the previous year. Operating income grew by 1.2 percent ($65 million), and non-operating income grew by 4 percent ($14 million). Total assets were $32.6 billion, up 2.6 percent ($830 million) from the previous year.
Results from the 2025 Annual Enterprise Survey (AES) indicated that total income for all New Zealand businesses decreased by 0.4 percent, AES total expenditure rose 1.2 percent, and AES total assets increased by 4.0 percent.
In 2025 compared with 2024, Māori authority businesses’ total surplus before income tax increased by $171 million (28 percent) to $781 million.
Operating surplus before tax (excludes non-operating income and non-operating expenses) grew by 15 percent ($93 million) in the 2025 financial year.
| Financial year | Non-operating surplus before tax | Operating surplus before tax |
| 2017 | 447187000 | 498108000 |
| 2018 | 238560000 | 592276000 |
| 2019 | 200037000 | 579818000 |
| 2020 | 50971000 | 431289000 |
| 2021 | 608138000 | 681414000 |
| 2022 | 734490000 | 715493000 |
| 2023 | 117428000 | 490487000 |
| 2024 | -11123000 | 620326000 |
| 2025 | 67226000 | 713295000 |
Debt-to-equity-ratio (defined as total liabilities divided by total shareholder equity) of Māori authorities was 35 percent in 2025, compared with 37 percent in 2024. For all New Zealand businesses in 2025, the debt-to-equity ratio was 188 percent. Māori authorities typically have a lower debt-to-equity ratio compared with non-Māori businesses. This is because Māori authorities tend to rely more on shareholder equity to fund business growth compared with non-Māori businesses, which rely more on creditors and loans.
Annual enterprise survey: 2025 financial year (provisional) has more information on financial performance for all New Zealand businesses.
Definitions and metadata
Data standard for Māori business provides a definition for collecting and producing data and statistics about Māori businesses. Māori businesses are those that are fully or partly owned by a person or people who have Māori whakapapa, and a representative of that business identifies the business as Māori.
Definitions of a Māori business for Tatauranga umanga Māori – DataInfo+ explains how we identified the enterprises included in this release.
Methodology for Tatauranga umanga Māori – DataInfo+ explains the methodology for each component of this release and provides more information on the data and tables.
Tatauranga umanga Māori: 2023 pūrongo matatini – Statistics on Māori businesses: 2023 technical report provides contextual and technical information about the publication of Tatauranga umanga Māori.
Overview of population changes
The table below provides an overview of changes to business and employee counts for other Māori enterprises for 2023 and 2024.
Counts of businesses – other Māori enterprises | |||
Year | New | Previously published(1) | Difference |
2023 | 4,710 | 4,464 | 246 |
2024 | 4,716 | 4,425 | 291 |
Counts of employees – other Māori enterprises | |||
Year | New | Previously published(1) | Difference |
2023 | 44,600 | 42,500 | 2,100 |
2024 | 46,400 | 44,000 | 2,400 |
1. Tatauranga umanga Māori – Statistics on Māori businesses: 2024 (English) | |||
Data updates to Tatauranga umanga Māori
We have revised the population and updated data for this release. The changed population means that data will differ from previous releases.
Text alternative for Proportion of Māori authorities, by industry, 2025
Infographic shows the percentage of Māori authority businesses by industry for 2025. Fifteen percent of businesses were in agriculture, 6 percent in other primary industries, 33 percent in non-residential property operators, and 46 percent in all other industries.
Text alternative for Proportion of other Māori enterprises, by industry, 2025
Infographic shows the percentage of other Māori enterprises by industry for 2025. Nineteen percent of businesses were in professional, scientific, and technical services; 17 percent in agriculture, forestry, and fishing; 11 percent in construction; 7 percent in health care and social assistance services; and 46 percent in all other industries.
Technical enquiries
Te tīma Tatauranga umanga Māori
[email protected]
04 931 4600
ISSN 2744-6417
Next releases
Tatauranga umanga Māori – Statistics on Māori businesses: June 2026 quarter will be released on 9 October 2026.
Tatauranga umanga Māori – Statistics on Māori businesses: 2026 will be released in August 2027.