The estimated population of New Zealand reached 4.92 million at 30 June 2019, Stats NZ said today.
New Zealand’s population grew by an estimated 76,000 in the year, or 1.6 percent.
“New Zealand’s population growth rate remains high by historical and international standards,” population insights senior manager Brooke Theyers said. “The world’s population is currently growing at 1.1 percent a year. New Zealand has exceeded this growth rate in each of the last five years.”
The largest driver of growth was net migration of 49,400, with 145,300 migrant arrivals and 95,900 migrant departures. Natural increase (births minus deaths) contributed 26,600.
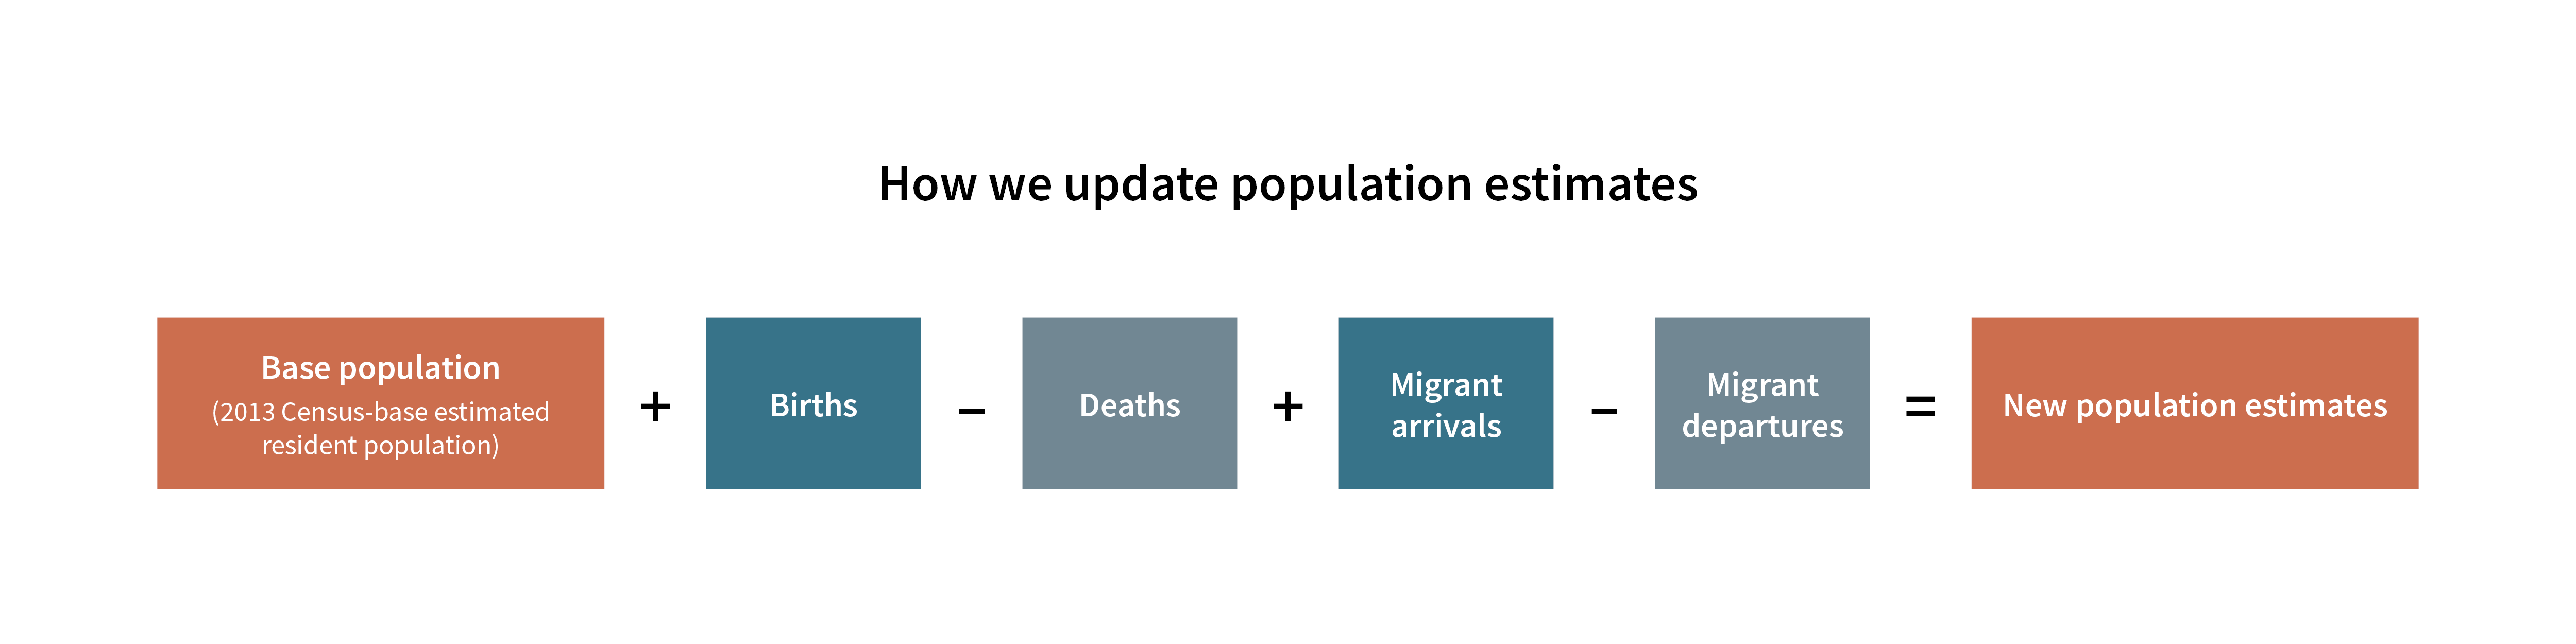
Text alternative for diagram, How we update population estimates.
We update population estimates quarterly from the last census-base estimated resident population (ERP) with estimates of births, deaths, and migration.
The estimates released today reflect the new outcomes-based migration measure, but not 2018 Census data, which will be available from 23 September 2019.
New Zealand’s population revised down 50,000
National population estimates (NPE) from the September 2013 quarter to the March 2019 quarter (inclusive) have been revised to incorporate the outcomes-based migration measure. Stats NZ introduced this measure in 2017, which defined migrants’ travel histories by using the ’12/16-month rule’. Spread over six years, this change resulted in a downward revision of about 50,000 for New Zealand’s resident population, an average of about 8,400 a year. Over the same period the population has grown by over 450,000.
“Adopting the outcomes-based migration measure means we’re measuring actual passenger behaviour, rather than their intentions at the time of travel,” Mrs Theyers said. “Our new method also removed statistical reliance on the passenger departure card, which was removed in November 2018.”
| Quarter | Original | Revised |
| Jun-13 | 4442100 | 4442100 |
| Sep-13 | 4457700 | 4455000 |
| Dec-13 | 4475800 | 4471500 |
| Mar-14 | 4496000 | 4492200 |
| Jun-14 | 4509700 | 4504500 |
| Sep-14 | 4531600 | 4525400 |
| Dec-14 | 4554600 | 4546700 |
| Mar-15 | 4580000 | 4571200 |
| Jun-15 | 4595700 | 4585600 |
| Sep-15 | 4620600 | 4609400 |
| Dec-15 | 4647300 | 4633700 |
| Mar-16 | 4675900 | 4662000 |
| Jun-16 | 4693200 | 4678100 |
| Sep-16 | 4719800 | 4702000 |
| Dec-16 | 4747200 | 4725300 |
| Mar-17 | 4776500 | 4751600 |
| Jun-17 | 4793900 | 4765400 |
| Sep-17 | 4817800 | 4785100 |
| Dec-17 | 4844400 | 4805400 |
| Mar-18 | 4871600 | 4829200 |
| Jun-18 | 4885500 | 4841000 |
| Sep-18 | 4907700 | 4861000 |
| Dec-18 | 4929700 | 4882500 |
| Mar-19 | 4957400 | 4907100 |
| Jun-19 | 4917000 |
The outcomes-based migration measure links traveller histories over time and classifies travellers as migrants according to whether they spend more than 12 of the next 16 months in, or out, of New Zealand following the border crossing. Migration Data Transformation project has more information.
Previously, national population estimates were calculated using the permanent and long-term migration (or intentions-based) measure, which classified travellers as migrants depending on their stated intentions on arrival and departure cards. When departure cards were discontinued in November 2018, we used the outcomes-based measure for population estimates from the December 2018 quarter on.
| Quarter ended | Original net migration estimate | Revised net migration estimate |
| Sep-13 | 8900 | 6200 |
| Dec-13 | 10200 | 8600 |
| Mar-14 | 12500 | 13000 |
| Jun-14 | 6700 | 5200 |
| Sep-14 | 16000 | 15100 |
| Dec-14 | 15700 | 13900 |
| Mar-15 | 17900 | 17000 |
| Jun-15 | 8700 | 7400 |
| Sep-15 | 18900 | 17900 |
| Dec-15 | 19400 | 16900 |
| Mar-16 | 20600 | 20300 |
| Jun-16 | 10200 | 9000 |
| Sep-16 | 19800 | 17100 |
| Dec-16 | 20000 | 16000 |
| Mar-17 | 21900 | 18800 |
| Jun-17 | 10500 | 7100 |
| Sep-17 | 18500 | 14200 |
| Dec-17 | 19100 | 12800 |
| Mar-18 | 19900 | 16500 |
| Jun-18 | 7500 | 5400 |
| Sep-18 | 16200 | 14000 |
| Dec-18 | 15100 | 14700 |
| Mar-19 | 20300 | 17000 |
| Jun-19 | 3700 |
Population estimates revision largest for young adults
Those in the younger working ages are more mobile than other population groups and tend to make up the bulk of migration flows. We can see small revisions across all ages, however, the largest revision is for those aged 20-34 years. The impact is greater for males than females.
| Age group (years) | Female | Male |
| 0-4 | -860 | -860 |
| 5-9 | 1170 | 1620 |
| 10-14 | 1300 | 1560 |
| 15-19 | 950 | 1220 |
| 20-24 | -8610 | -9320 |
| 25-29 | -11080 | -18870 |
| 30-34 | -3030 | -7820 |
| 35-39 | 1670 | 990 |
| 40-44 | 1980 | 1550 |
| 45-49 | 1080 | 860 |
| 50-54 | -40 | -320 |
| 55-59 | -250 | -420 |
| 60-64 | -360 | -370 |
| 65-69 | -480 | -520 |
| 70-74 | -680 | -630 |
| 75-79 | -430 | -480 |
| 80+ | -420 | -470 |
Population estimates provisional for 18 months
Previously, the migration component of the national population estimates was final six weeks after the reference period. Estimates of births and deaths are final after four months, which enabled us to finalise estimates four months after the reference period.
The outcomes-based migration measure requires observing travellers for up to 16 months after their initial border crossing, so we must use a model to provide timely estimates of migration. These provisional estimates are updated on a monthly basis. This is because the proportion of border crossings that can be classified with certainty increases over time.
We are investigating options for future population estimates updates to minimise volatility, while producing the best estimates possible using the most up-to-date migration information.
Impact on other official statistics
Population estimates affect other important statistics across a range of economic and social areas. From August 2019, publications in these areas will reflect the revised population estimates and comment on any impacts.
Future releases
Subnational population estimates: At 30 June 2019 (provisional) will be published on 22 October 2019. These estimates will be consistent with the revised national series.
The national population estimates series is still based on 2013 Census data. The population estimates will be revised when the 2018 Census-based estimated resident population is published in March 2020.
Text alternative for diagram How we update population estimates
Diagram showing an equation in words and boxes: Base population (2013 Census-base estimated resident population) plus births minus deaths plus migrant arrivals minus migrant departures equals new population estimates.


